When the logistics facility stopped arguing and started to decide

Taking advantage of the Casambi system already installed and gaining global control.

Let’s take a look: Before, a logistics centre with energy expenditure control problems, data that did not add up, lack of information and constant internal fights. Now, data that does add up, information per shift, per pallet, real kWh/h of each aisle, zone, technical corrections of issues that were previously unknown…

Casambi+Adquio_SCADA_Server+PowerTrace

Energy that fizzles, productivity that doesn't fit in

Adquio PowerTrace, El problema

It’s 6:45 in the morning, Carlos opens the laptop before the kick-off meeting.

On your tray:

  • A service level agreement penalty claim.
  • An Excel from the CFO with a power curve he doesn’t understand.
  • Two shift bosses fighting over resources.

What is not in any email (but beats in every conversation) is the question that has been haunting him for months: where does the energy go and why doesn’t it fit with productivity?

The invisible cost

  • Picking corridors ensure that they cannot lower the light without losing pace.

  • At the docks, lighting is kept high “for safety,” although no one remembers when that criterion was reviewed.

  • At night, consumption almost equals daytime consumption, despite processing fewer orders.

  • The “by eye” distribution by surface means that each area pays what does not correspond to it and no one can defend it with data.

Adquio ProwerTrace, los datos de partida

Result: meetings with discussions without evidence, decisions that do not move the needle and the constant feeling of spending blindly. In a warehouse that lives on detail (times, routes, shifts), the lighting is still out of control: lots of energy, little traceability and zero objective criteria to adjust without compromising safety or productivity.

The option that seemed "too good"

Adquio  PowerTrace, La prueba

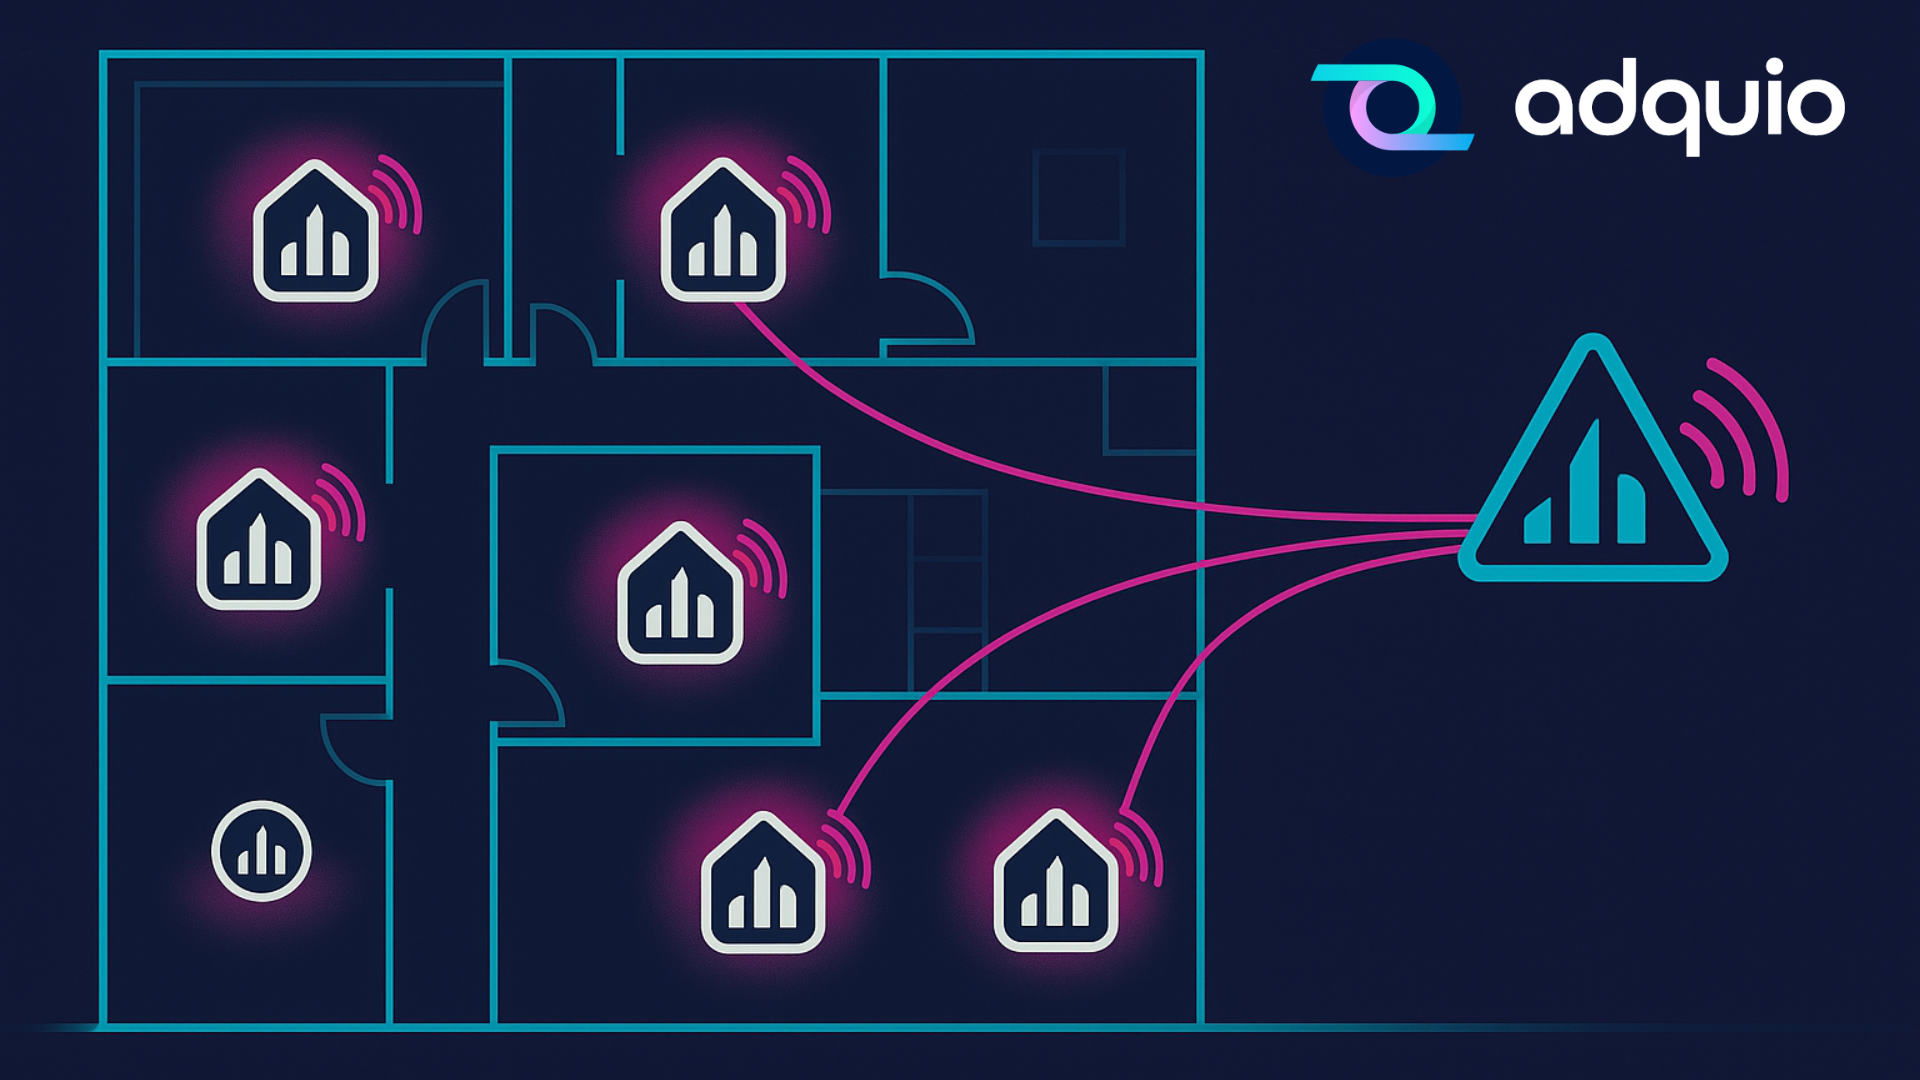
A partner tells you about Adquio PowerTrace for Casambi: without installing physical meters, it converts lighting events into power and energy by zone and shift, and contrasts it with overall equipment efficiency and service level agreement indicators.

Carlos raises an eyebrow. He has already seen beautiful panels. But three sentences stop him in his tracks:

  • No additional hardware: take advantage of your Casambi network.”
  • Kilowatt hours per aisle, dock and shift in real time.”
  • Kilowatt hours per unit processed, compared to your warehouse management system.”

He decides to test it in two corridors and two springs for ten days.

Easy deployment, no construction work required

That same day, the luminaires are mapped to the operational zones—Aisles 11–14 and Loading Bays 5–8—and validated with the shift supervisors to avoid ambiguities. Human Resources imports the actual shift schedules: clock-ins and clock-outs, breaks, night shifts, and weekends. Occupancy windows and time-slot lighting levels are defined so as not to compromise safety or the picking pace.

A data connector starts reading the processed units from the warehouse management system every five minutes, without touching production: it just listens, correlates and records. With this, lighting events are linked to workload, times and zones, paving the way for measuring kilowatt-hours per aisle and per dock.

At 16:00, the first heat map is already drawing something uncomfortable: flat patterns where there shouldn’t be any, peaks where activity drops… clear signs that light and operation don’t always walk together.

Adquio PowerTrace, la implantación
Adquio PowerTrace, primeros resultados

The turnaround in the data

  • Pier 7 consumed three times as much as its twin: the security scene never dropped below 80% because of a “temporary” forced manual override that had been active for months. No one had checked it; it was left out of the procedures and continued to drain energy every night.

  • Aisle 12 appeared on with no activity due to false presence detections in one section: a misdirected sensor raised the scene to 100% even though there was no traffic.

  • In the night shift, the kilowatt hour per box was 40% higher: fewer picks per hour, but the same light curve as during the day, as if the operation did not change. An invisible cost… until now.

There was no shouting; there was silence. For the first time, everyone was looking at the same data and understood the same story.

Small adjustments, big results

1️⃣ Scenes in turn

Daytime from 70 % to 60 %; nighttime from 60 % to 35 %, with gentle ramps to avoid glare and unnecessary peaks. Transitions are aligned with actual changes in activity.

2️⃣ Presence windows

From 20 minutes to 5 minutes in aisles with low turnover. If there is no sustained detection, the light drops to the minimum level and rises again when motion is detected.

Adquio ProwerTrace, empieza los bueno

3️⃣ Rule on springs

If no platform is assigned in the transport management system, the illumination automatically drops to 15%. When a platform is assigned or a truck arrives, the scene rises to the operating level; at the end of the operation, it drops after a safety time.

4️⃣ Maintenance

Corrects the Aisle 12 sensor (false presence) and eliminates the forced manual control of Pier 7. Everything is documented for traceability.

5️⃣ Scorecard

Kilowatt hours per unit, kilowatt hours per pallet, kilowatt hours per shift and alerts when a zone falls out of expected range. Adjustable thresholds, comparative history and change logs to explain every improvement and every deviation.

From discussions to metrics: immediate certainty

Adquio PowerTrace, Satisfacción

At 14 days, the curves stop fighting each other. The patterns by zone and shift begin to fit together:

  • 17% of total kilowatt hours in the pilot area.

  • -23% in kilowatt hours per pallet at the docks.

  • Zero lighting penalties at month-end closing (the first time this year).

  • A clean argument for planning: “Here consumption rises without productivity; here it is justified”.

Friday, 12:10. The CFO writes: “Finally energy and production match. Let’s copy this to the whole plant”.

Carlos leans back in his chair. There are no heroes or culprits. There is a method: traceable data, simple rules and adjustments that respect the operation. And, above all, there is peace of mind: the feeling that every kilowatt hour has an explanation… and a clear person in charge.

Why PowerTrace changes the conversation !

  • Without additional hardware of Casambi events at power → kWh per zone.
  • Express deployment: mapping of zones and shifts in hours, first data the same day.
  • 📊 KPIs that matter: kWh/UD, kWh/pallet, kWh per shift, alerts.
  • 🧩 Connect with what you already have: WMS/TMS, OEE, SLAs.
  • 🌍 Scalable by design, from one aisle to all your ships.

When energy is measured as the operation worksis no longer an opaque expense, it becomes a productivity lever.

Take the first step today. Ask for a pilot in two corridors and a dock. If in 10 days you do not see clarity (and relief), you don’t go on. It’s as simple as that.

Related Posts

Leave a Reply

Privacy Overview
Adquio

This website uses cookies so that we can provide you with the best user experience possible. Cookie information is stored in your browser and performs functions such as recognising you when you return to our website and helping our team to understand which sections of the website you find most interesting and useful.

Strictly Necessary Cookies

Strictly Necessary Cookie should be enabled at all times so that we can save your preferences for cookie settings.