
Adquio Analytics

Adquio Analytics
Turn your installation data into a clear view.
Explore historical data, compare variables and build dashboards for each building and each team. Adquio Analytics turns the measurements collected by DataSource into charts, indicators and useful answers for operations.
From data to decisions
Technical information becomes valuable when you can explore, compare and share it clearly.
Explore the history
Choose time ranges, expand charts and compare signals to understand how an installation has changed.
Dashboards built for you
Bring indicators, trends, tables and visualizations together in dashboards tailored to each project.
Information for every role
Organize dashboards in groups, save favorites and separate administration from read-only access.
Everything you need to see in one dashboard
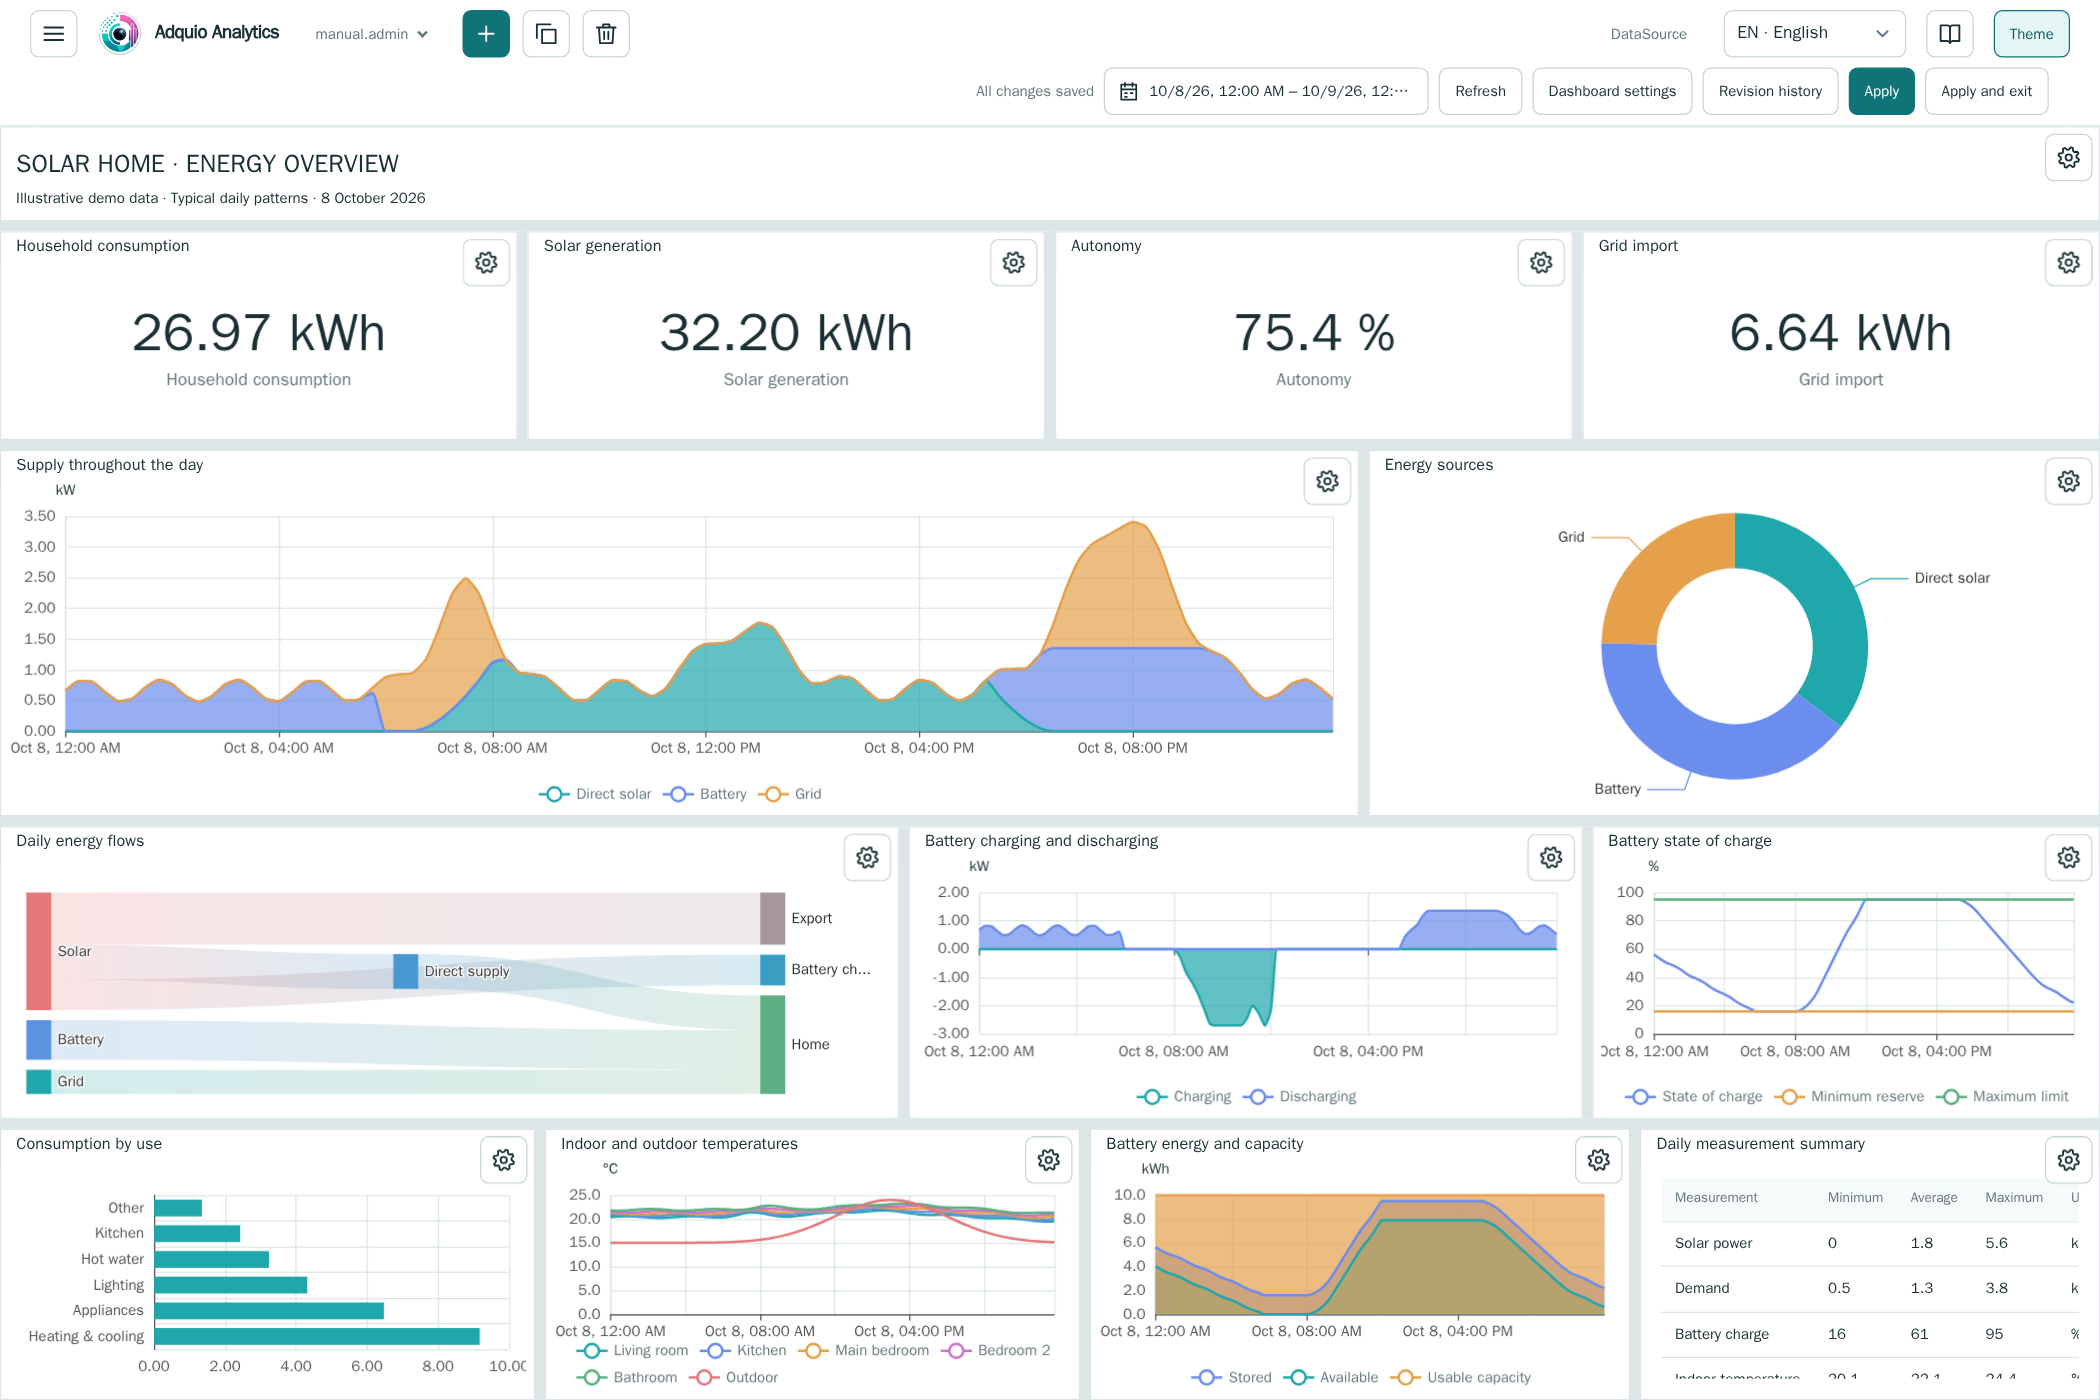
Combine consumption, generation, demand, balances and trends in a view designed for operations. Read the main figures at a glance, then explore the time detail you need.
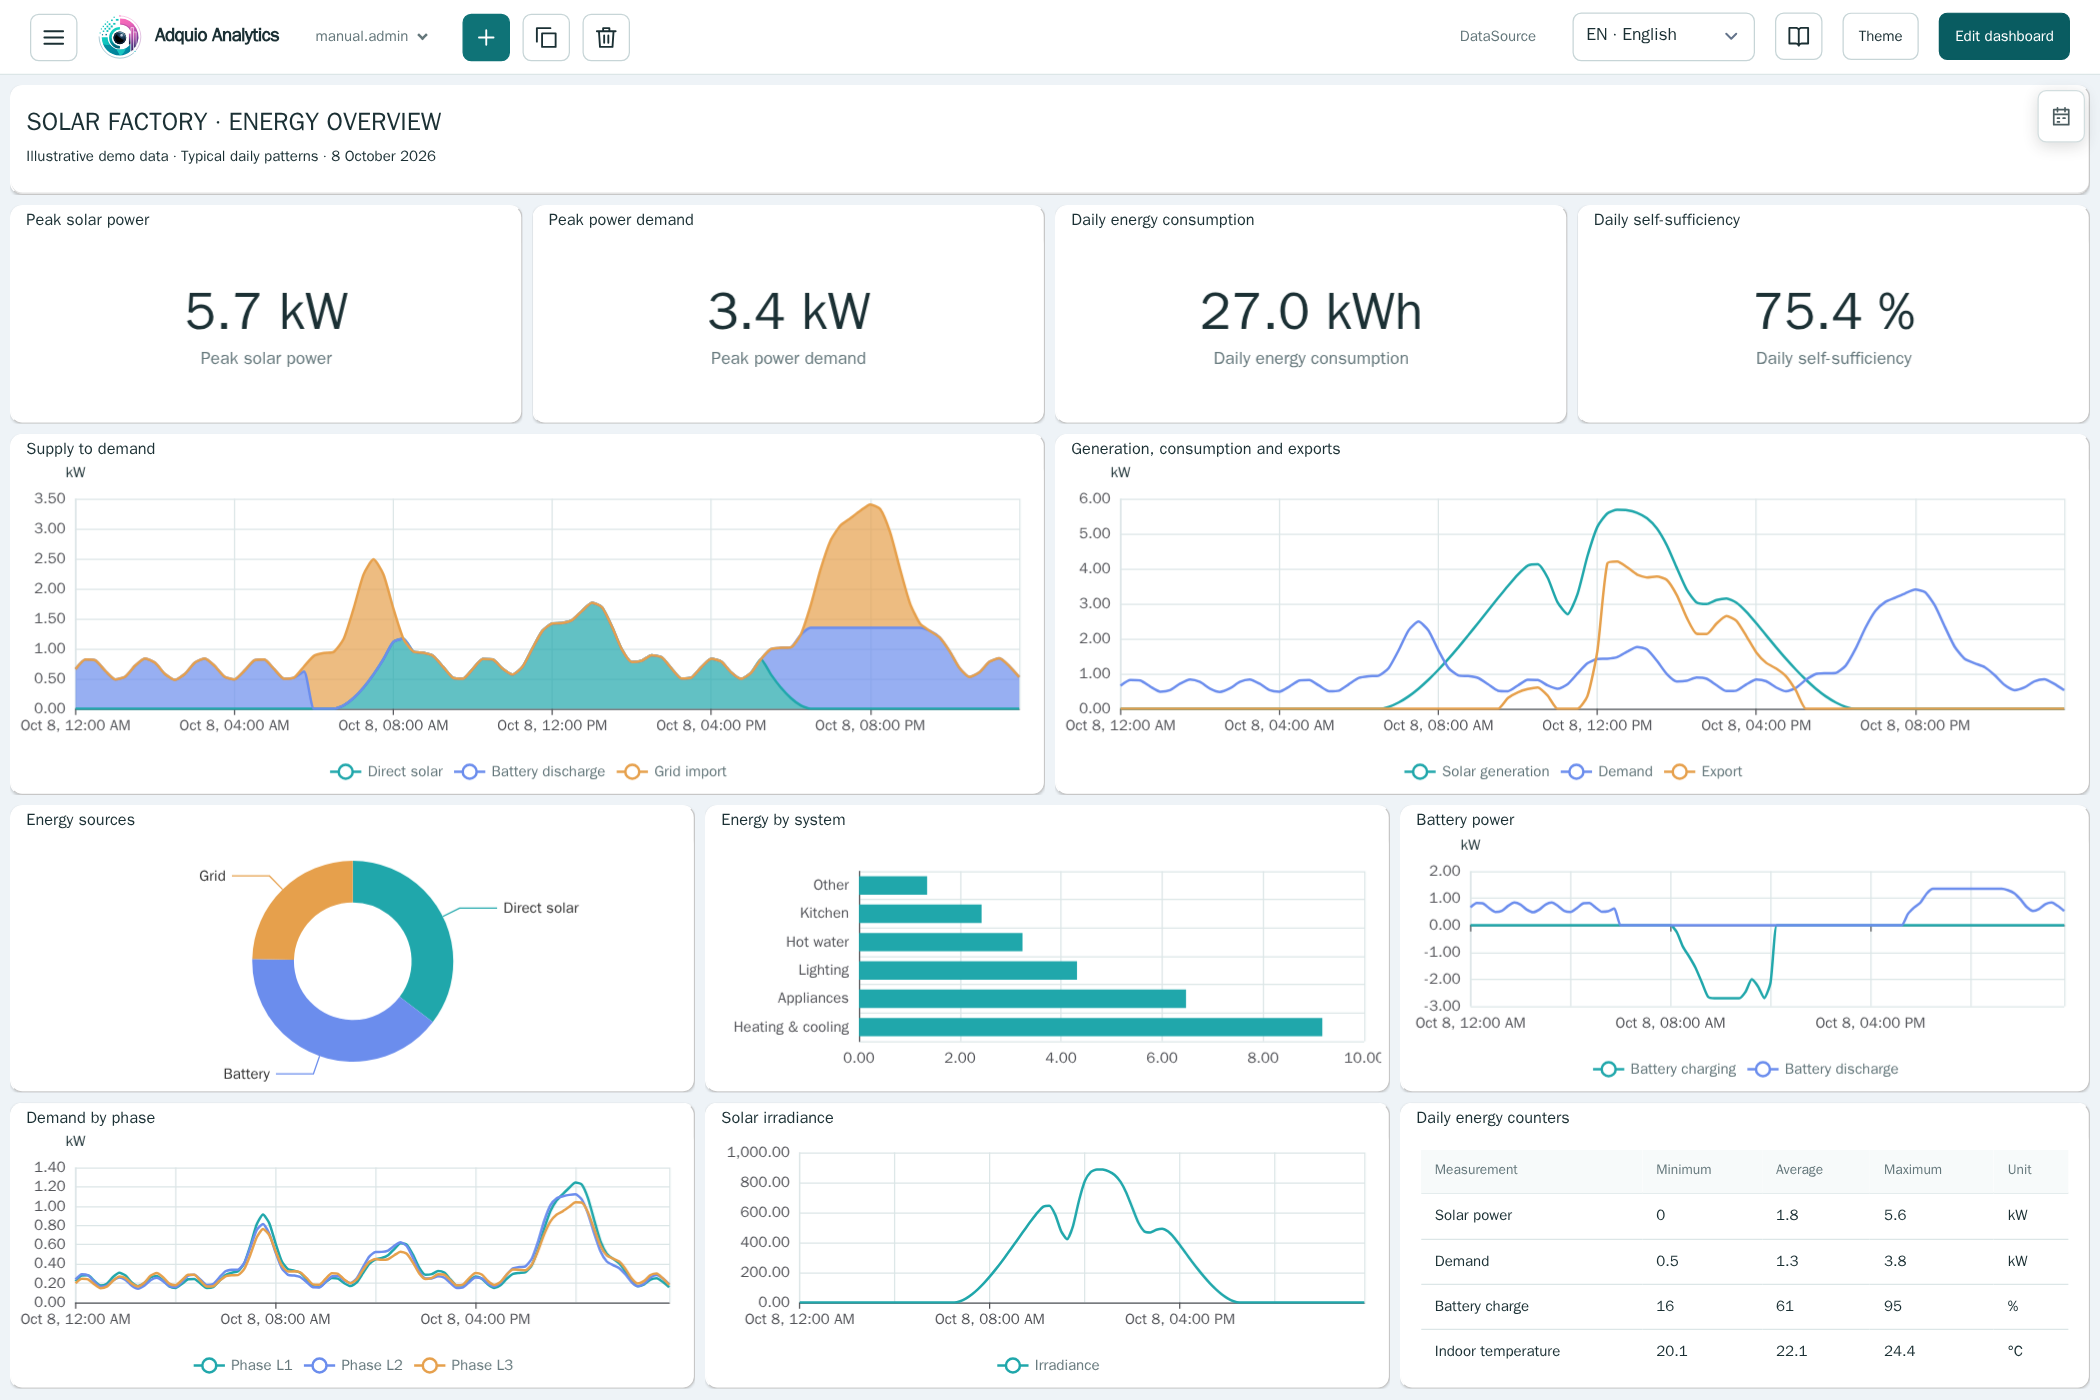
One tool, different questions
Each dashboard can reflect the available variables and the decisions your team needs to make.
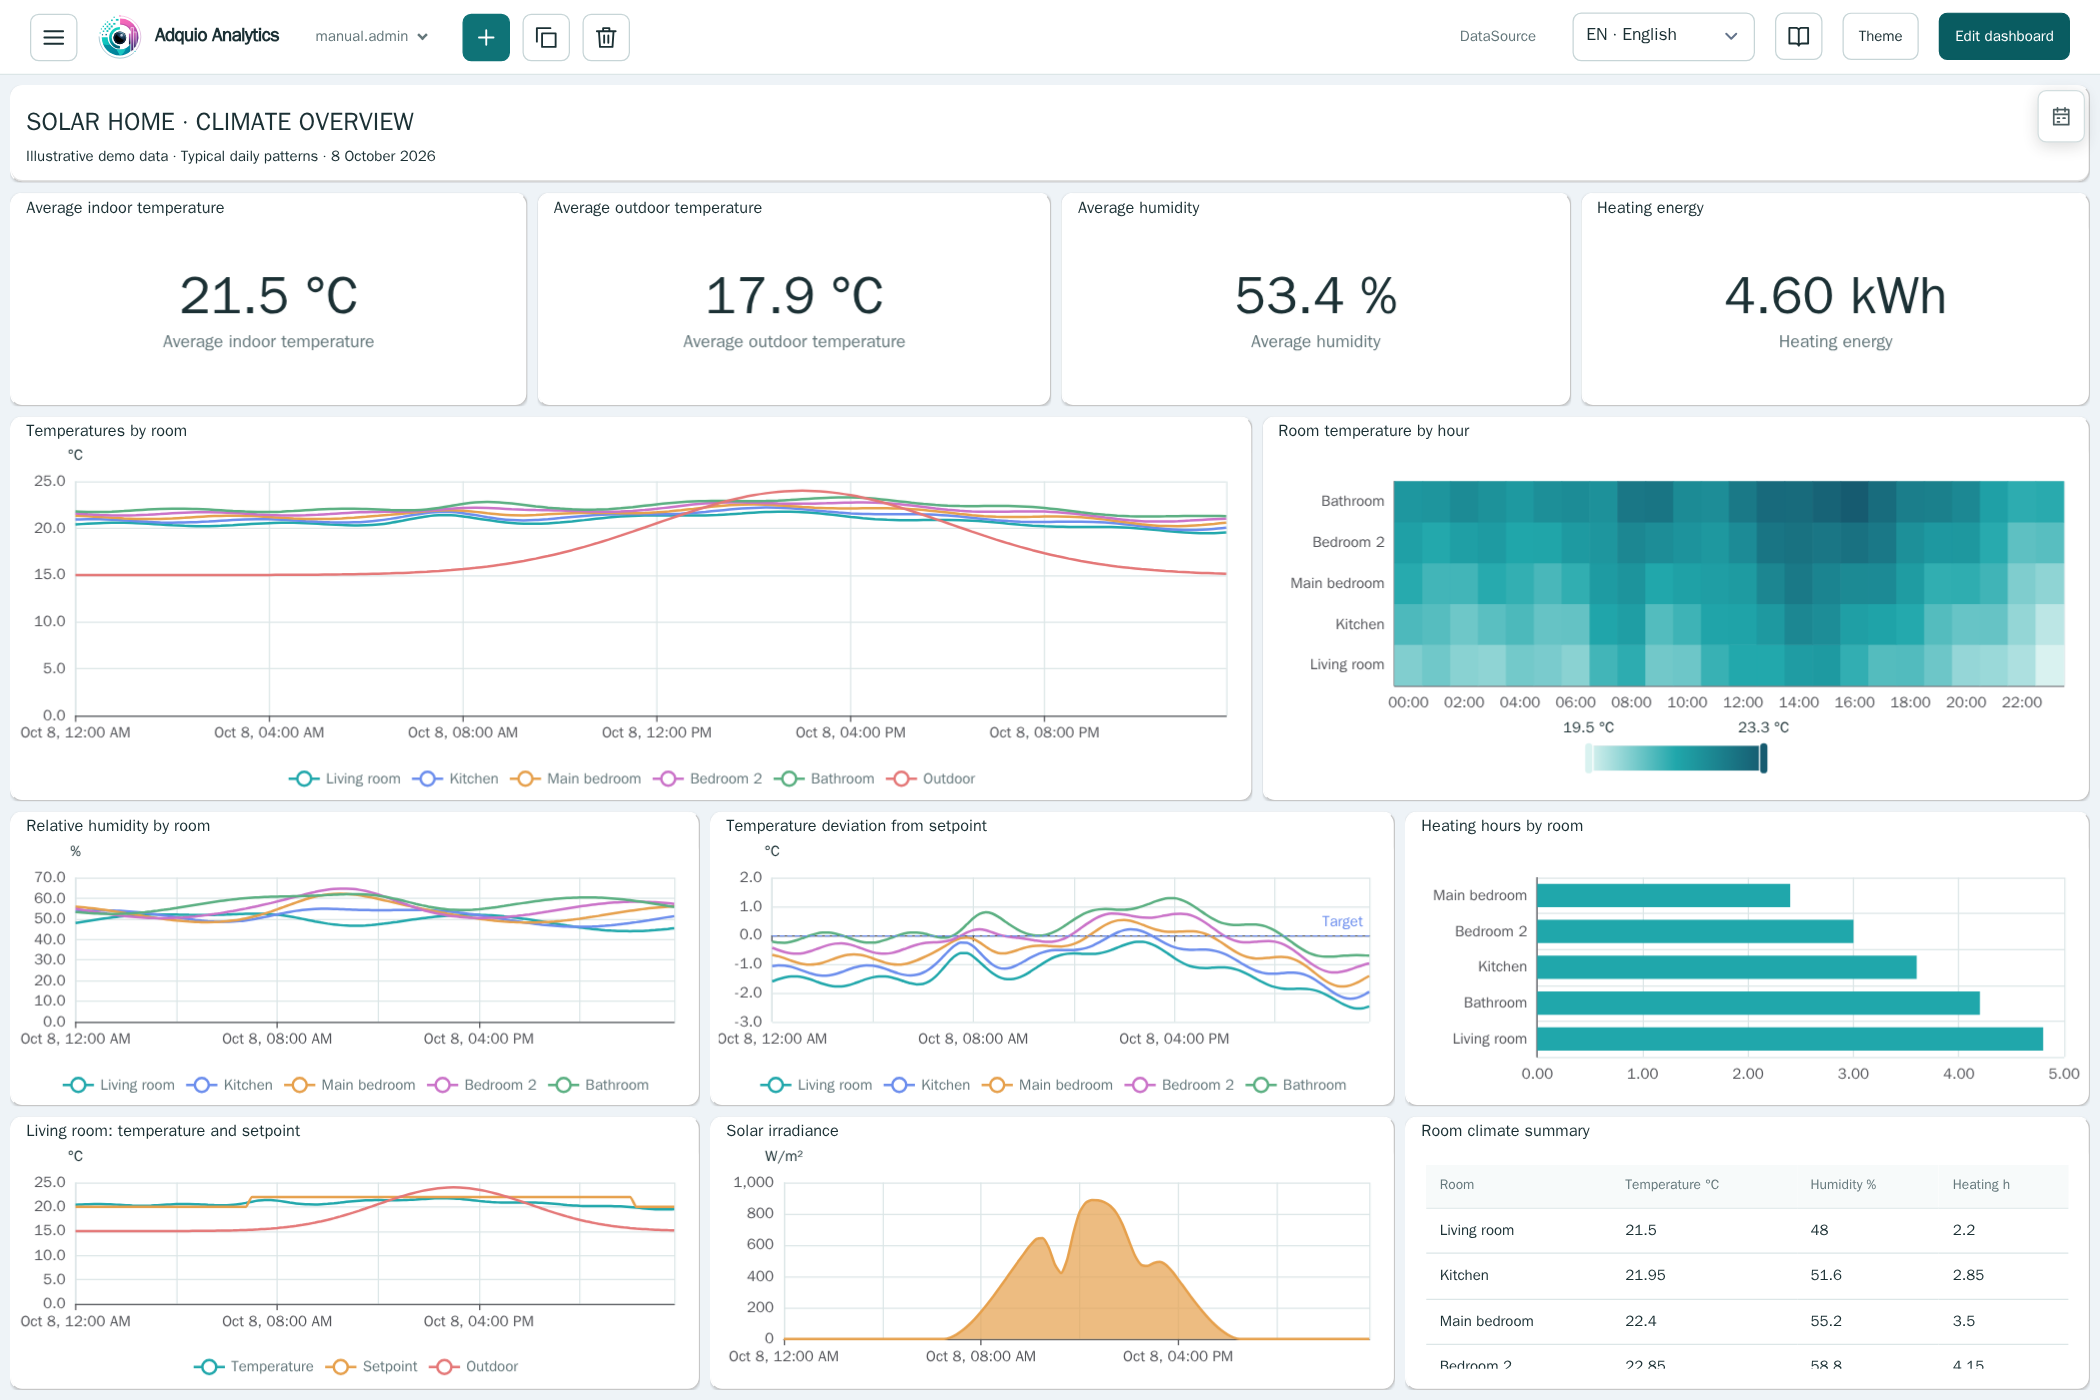
Comfort and climate
Compare temperature, humidity and time periods by room to spot differences and trends.
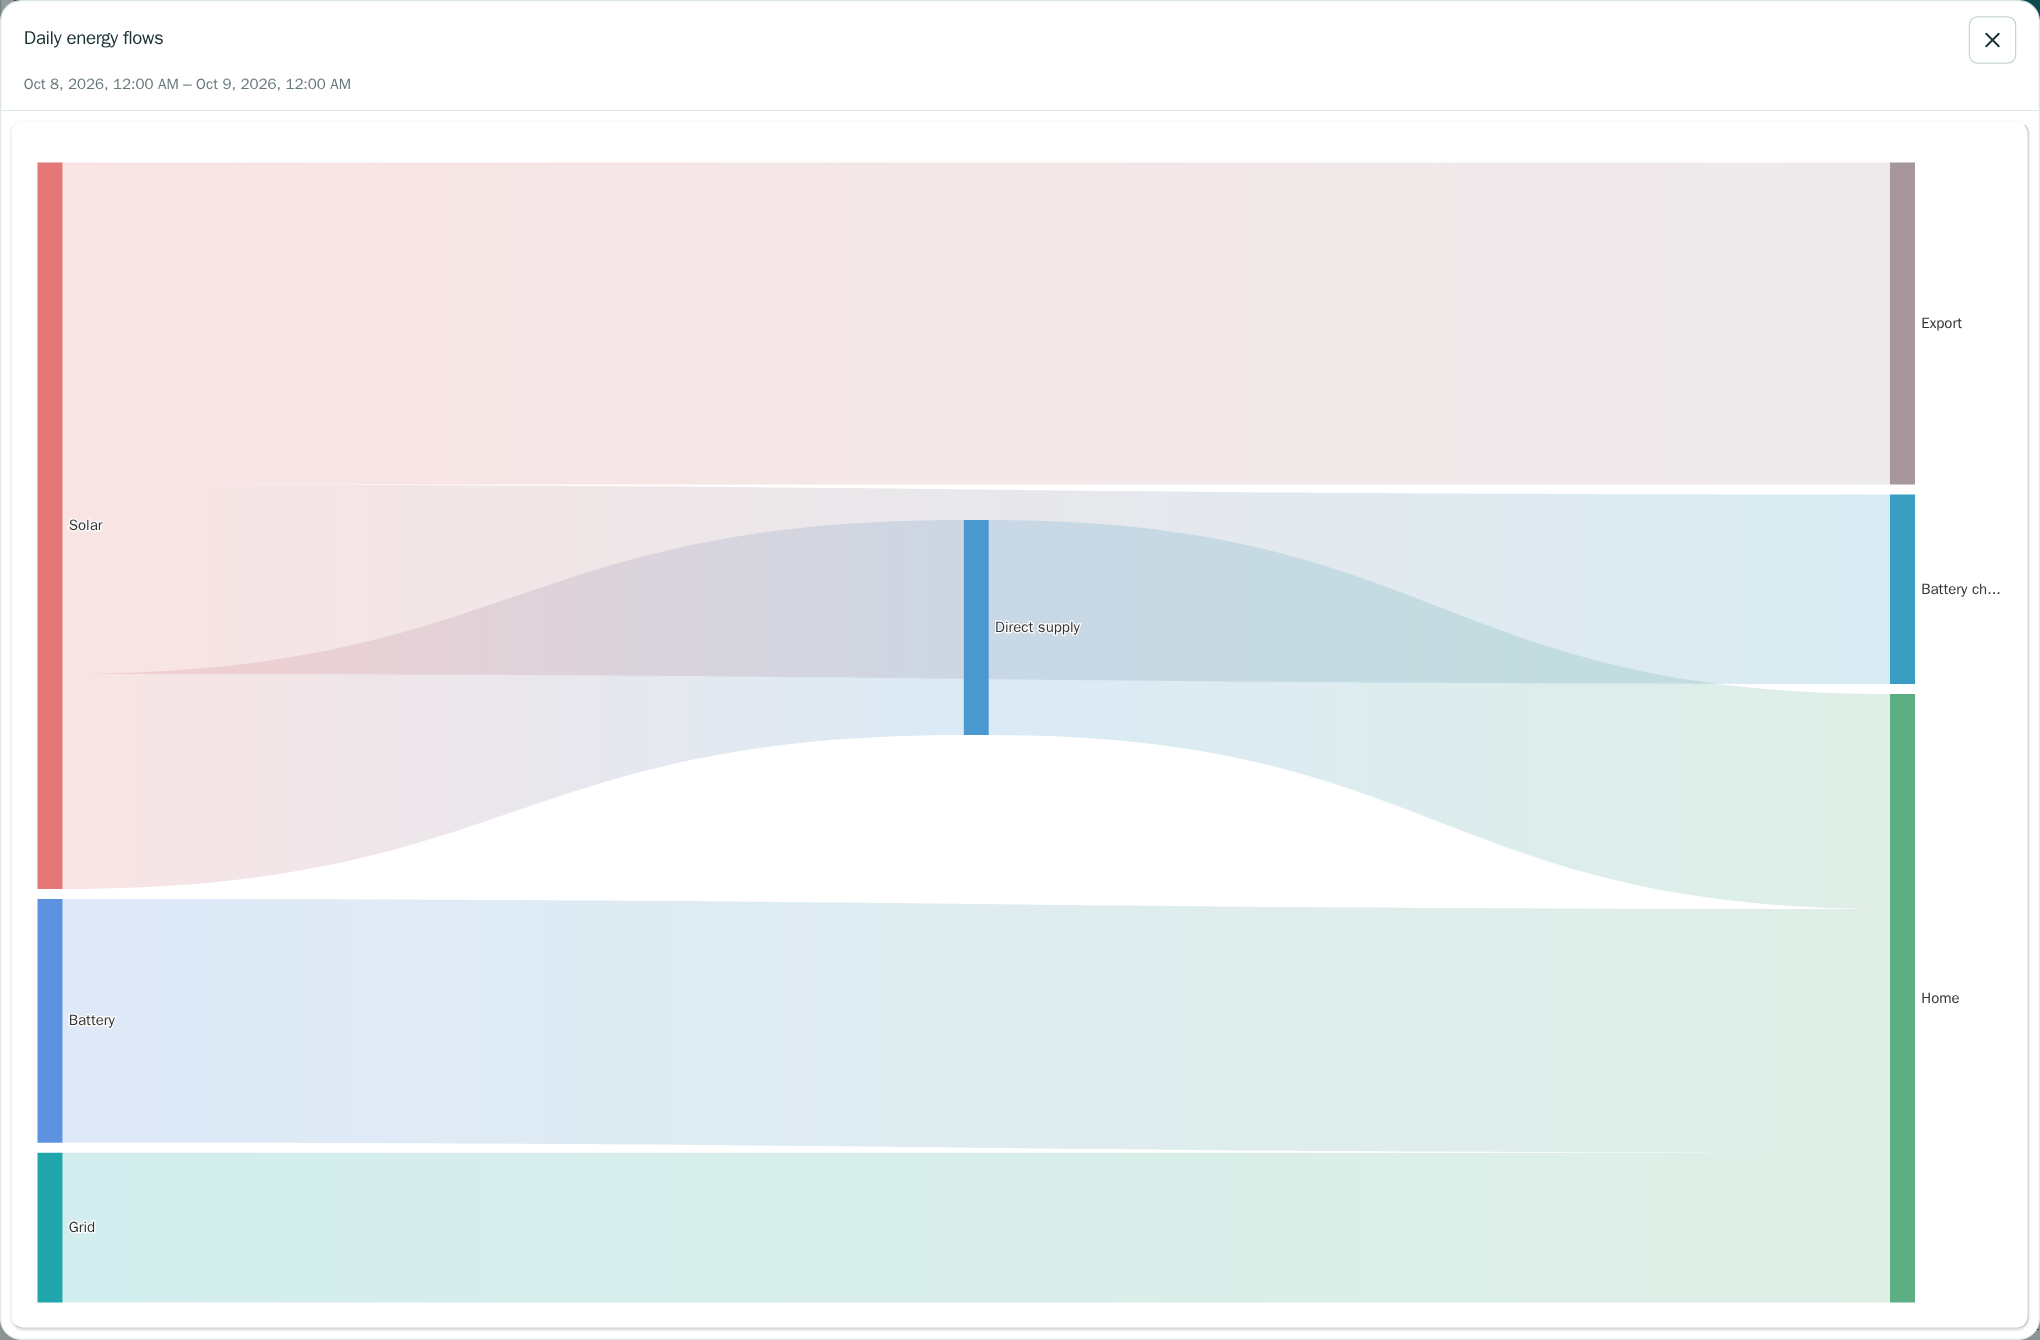
Energy and flows
See where energy comes from and how it is distributed through indicators, charts and visual flows.
Explore history without losing context
The guided series builder lets you choose a controller, device, variable and operation, then compare up to twelve series in one panel. Work with original or aggregated values, change the dashboard time range or set a specific range for one panel.
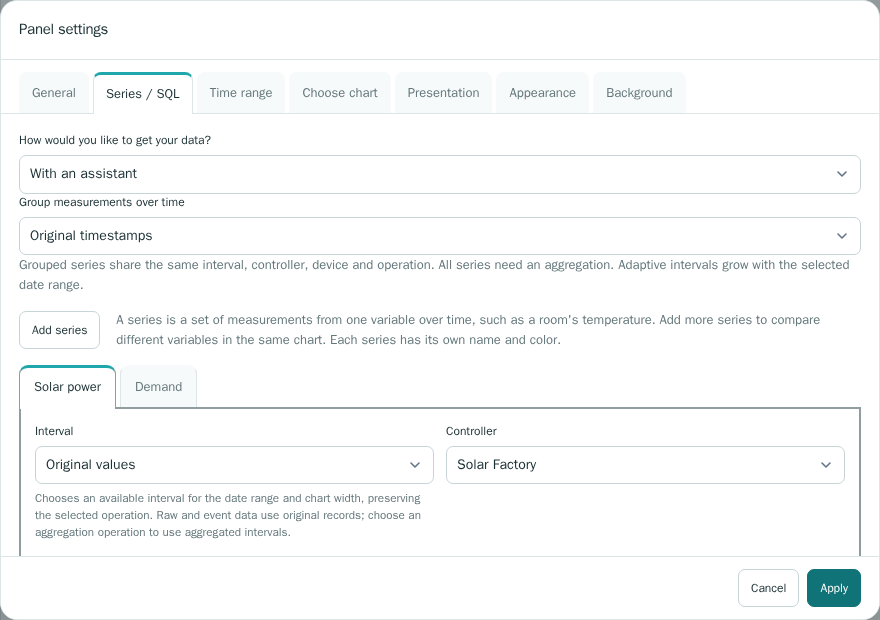
Compare over time
Select dates and zoom into an interval to examine changes and peaks.
Comparable measures
Apply aggregations and unit conversions to present each signal on the right scale.
Advanced queries
When an analysis calls for it, administrators can use read-only SQL and review the query produced by the guided builder.
Build the dashboard each installation needs
Arrange panels on a flexible canvas. Start with a blank dashboard or an energy, climate or monitoring template, connect actual variables and adjust titles, sizes, thresholds and presentation.
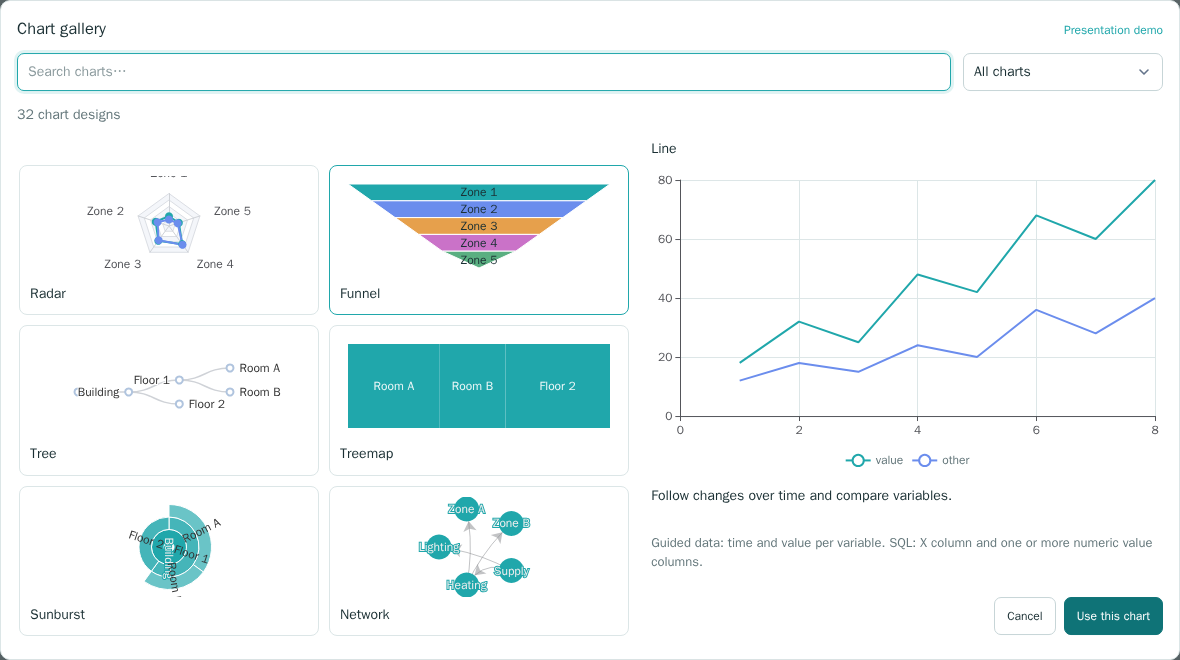
Choose the view that best explains each value
Lines, bars, gauges, heatmaps, tables, flows and other visualizations answer different questions. The gallery shows requirements and a preview before you choose a design.
Built for teams
Role-based access
Administrators create and edit dashboards; read-only users can explore and interact with the dashboards available to them.
Share one panel
Create a revocable link to view a specific panel without exposing other dashboards or allowing edits.
Adaptable interface
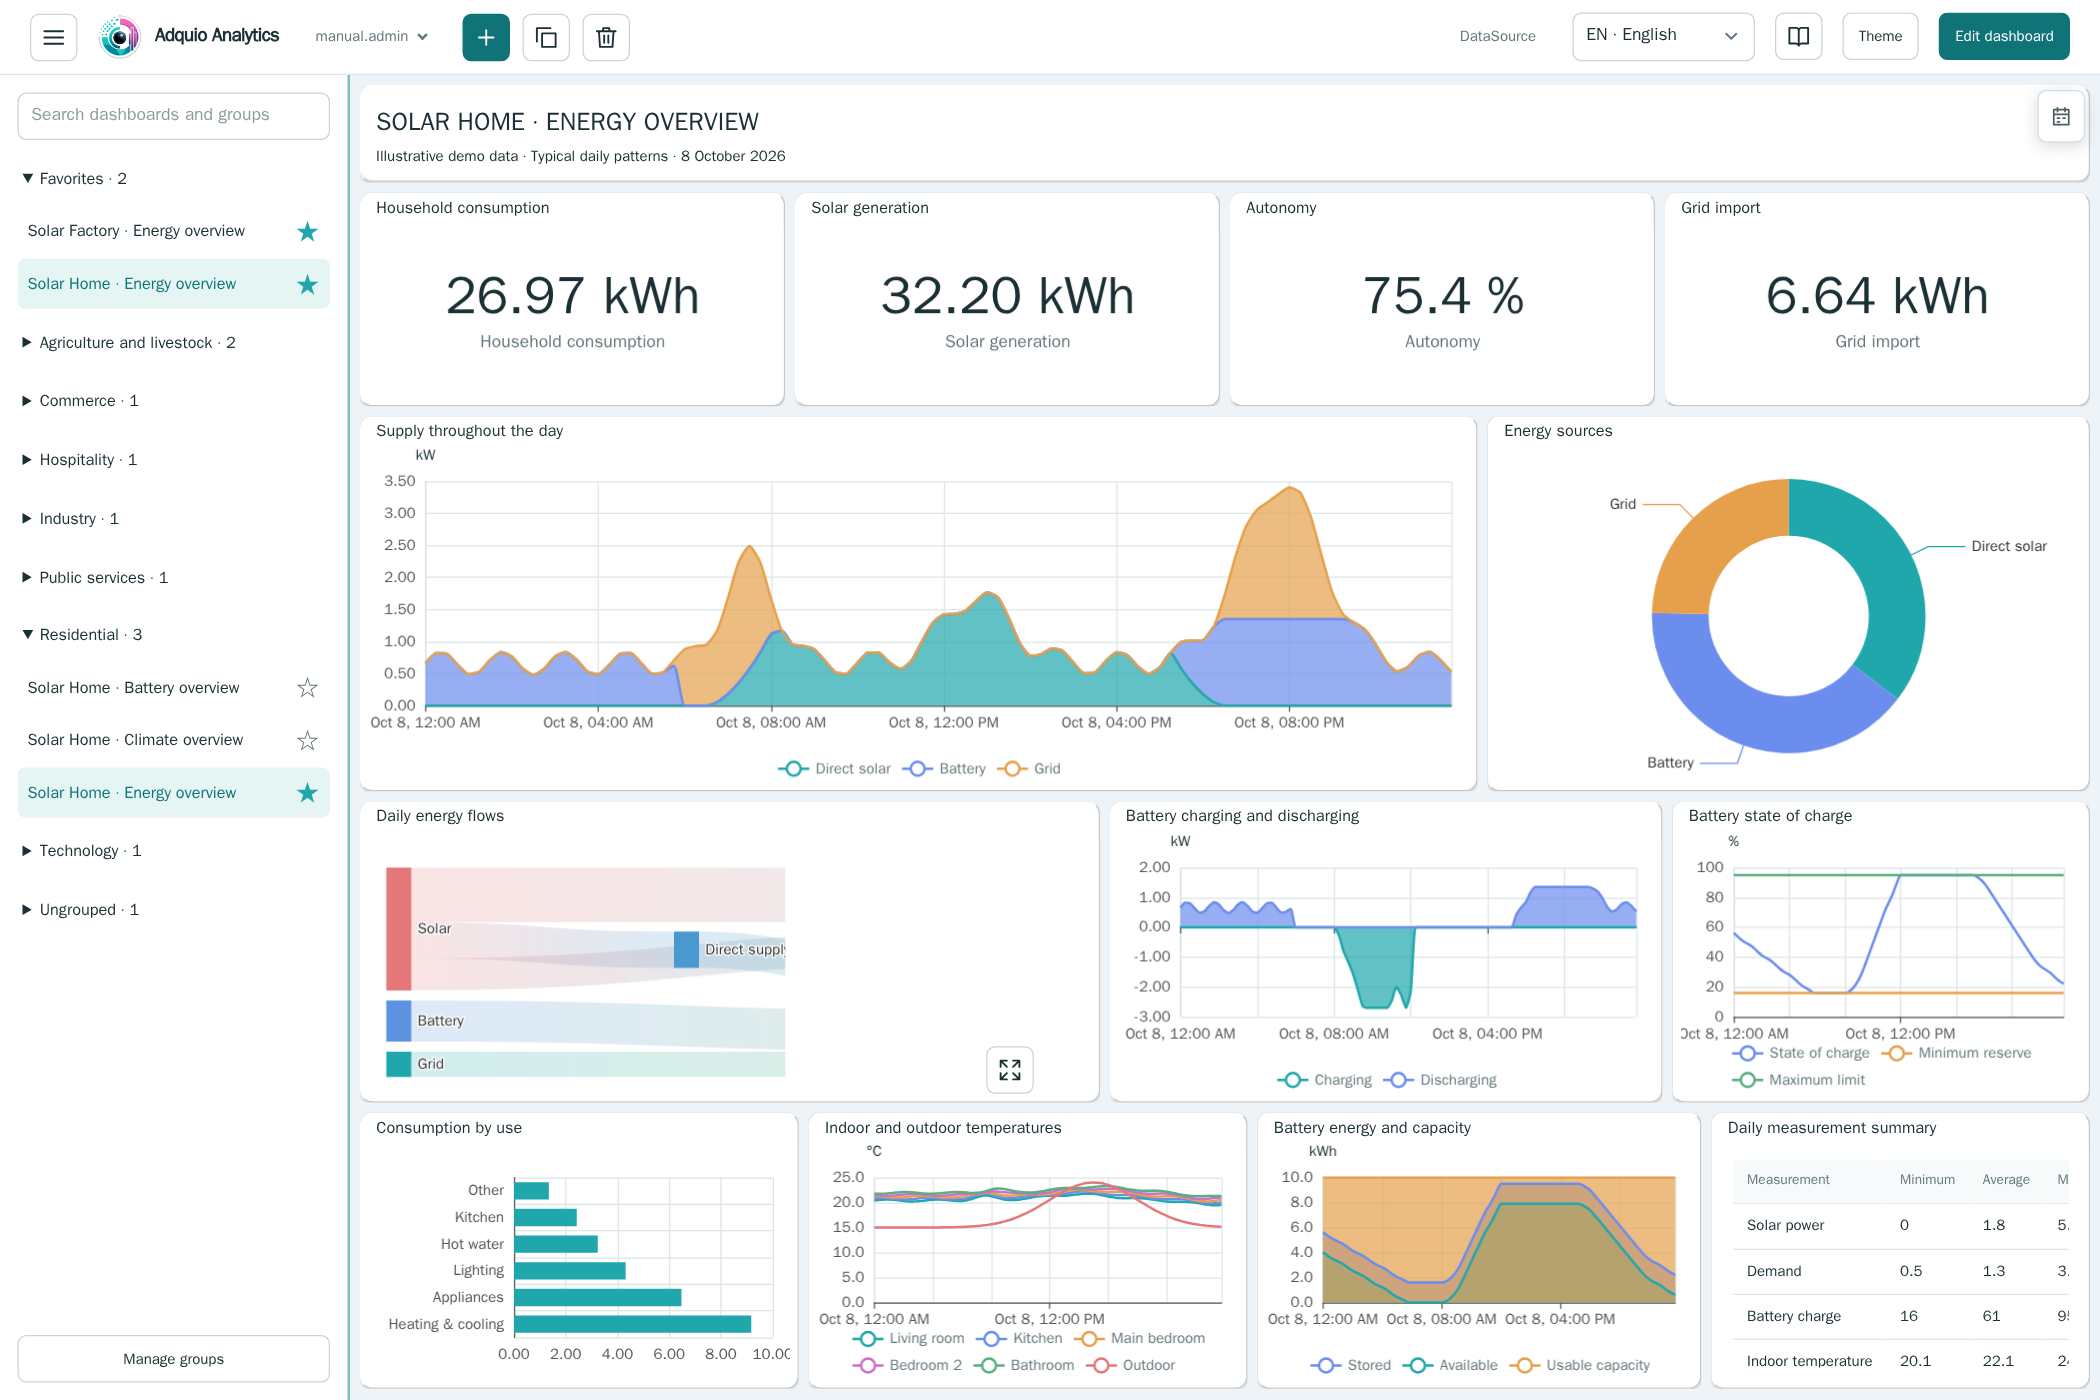
Choose from 18 languages, light or dark mode, and navigation with groups and personal favorites.
How it fits into the Adquio ecosystem
DataSource collects and prepares measurements; Analytics queries them so each role can interpret the results. Adquio Supervisor gives you a view of device status and operations.
01 · Field
Controllers and installation variables
02 · Data
DataSource organizes historical measurements
03 · Analysis
Analytics presents dashboards and trends
Make your installation data useful to your team.
Tell us what you need to measure, compare or present and we will show you how Adquio Analytics fits your project.
