ADQUIO ANALYTICS · USE CASES
Reducing greenhouse consumption without looking at the crop leaves the most important part of the decision out of view.
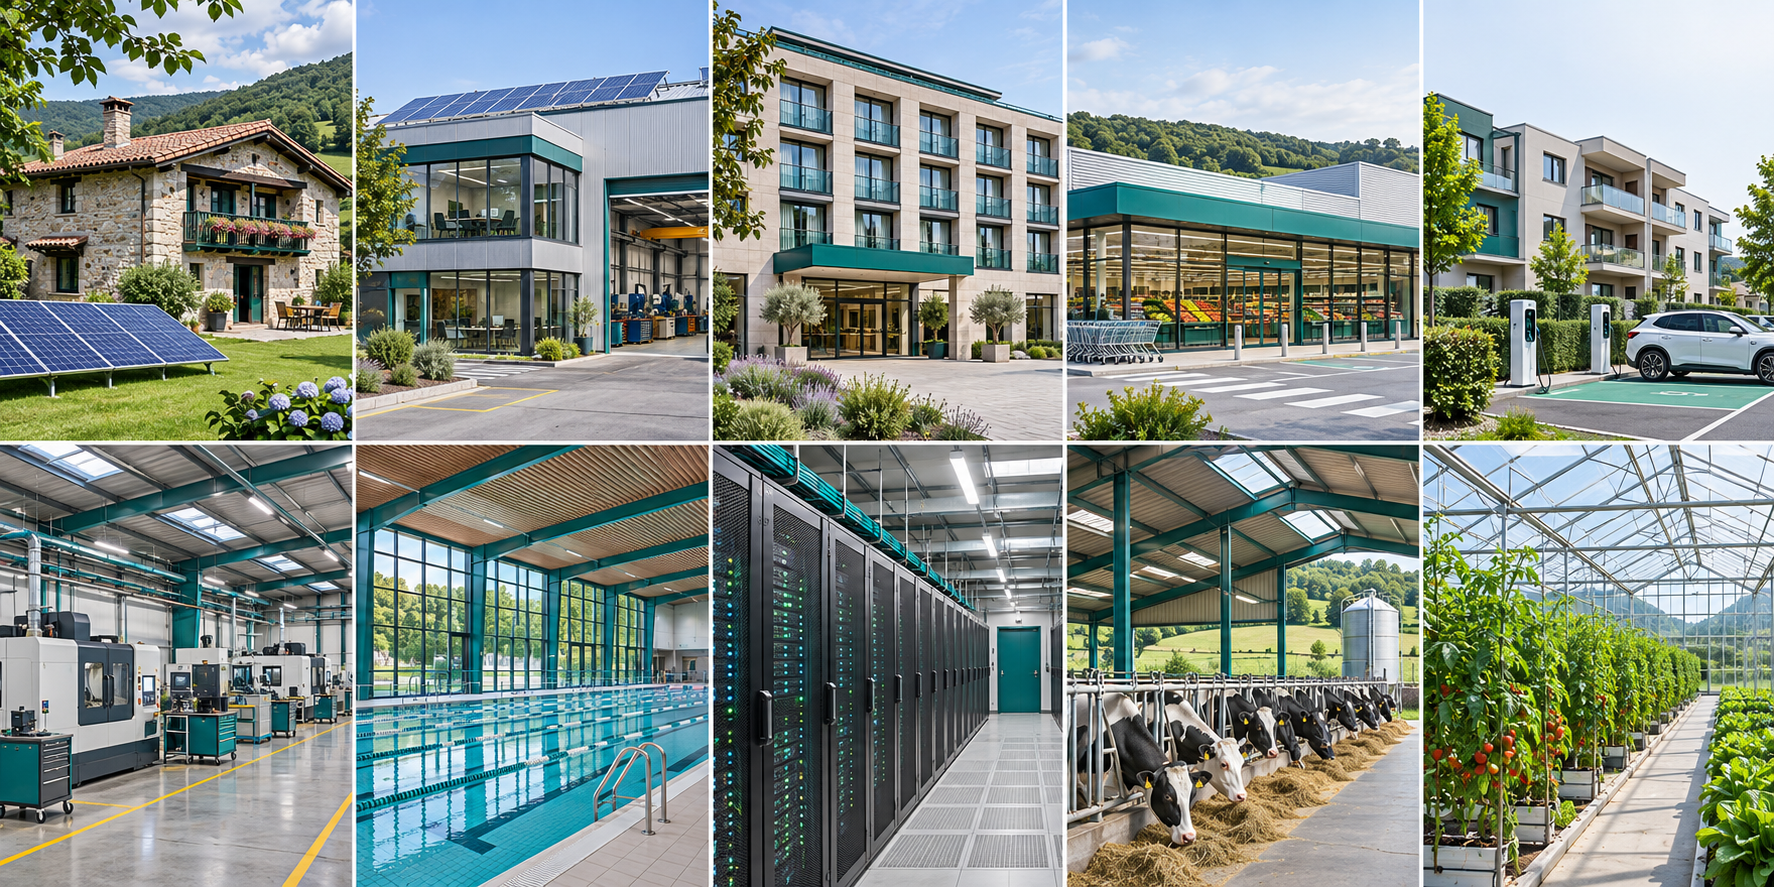
This article presents a use case with simulated data. The main image is a generated illustration; the screenshots show the Adquio Analytics interface.
The scenario: Solar Greenhouse
The example includes 5,000 plants across 2,000 m², with eight irrigation sectors, six workers and solar generation with storage. Lighting, ventilation and heating support the crop’s environmental targets.
Analytics relates temperature, humidity, carbon dioxide and irrigation to technical demand. Daytime and night-time differences provide essential context.
Questions this example helps answer
Visualisations become useful when they support a specific decision. This example helps explore the following questions:
How does the growing environment compare with its setpoints?
When do irrigation and fertigation operate?
Which loads coincide with solar production?
Technical reference for the example
These values define the reference scenario. They are simulation parameters, not a specification for a verified customer installation.
| Parameter | Model reference |
|---|---|
| Reference floor area | 2000 m² |
| Team | 6 people |
| Photovoltaics | 100 × 400 W modules = 40 kWp |
| Inverters | 3 × 15 kW |
| Nominal battery capacity | 80 kWh |
| Nominal storage voltage | 51.2 V |
| State-of-charge window | 20–90% |
| Storage efficiency | 96% in each direction |
| Simulator update interval | 60 seconds |
| Weather update interval | 60 minutes |
| Crop | 5,000 plants · 8 irrigation sectors |
| Temperature targets | 22 °C daytime · 16 °C night-time |
| Humidity and carbon dioxide | Air humidity 72% · soil moisture 42% · CO₂ 850 ppm |
| Irrigation | 15,000 l tank · 4.5 kW pump |
| Grow lighting | 30 kW |
| Ventilation and heating | 3.5 kW ventilation · 120 kW thermal heating |
The dashboards, explained
Each view answers a different question. Select a thumbnail to open a large image; use the viewer to move to the next dashboard or switch to full screen.
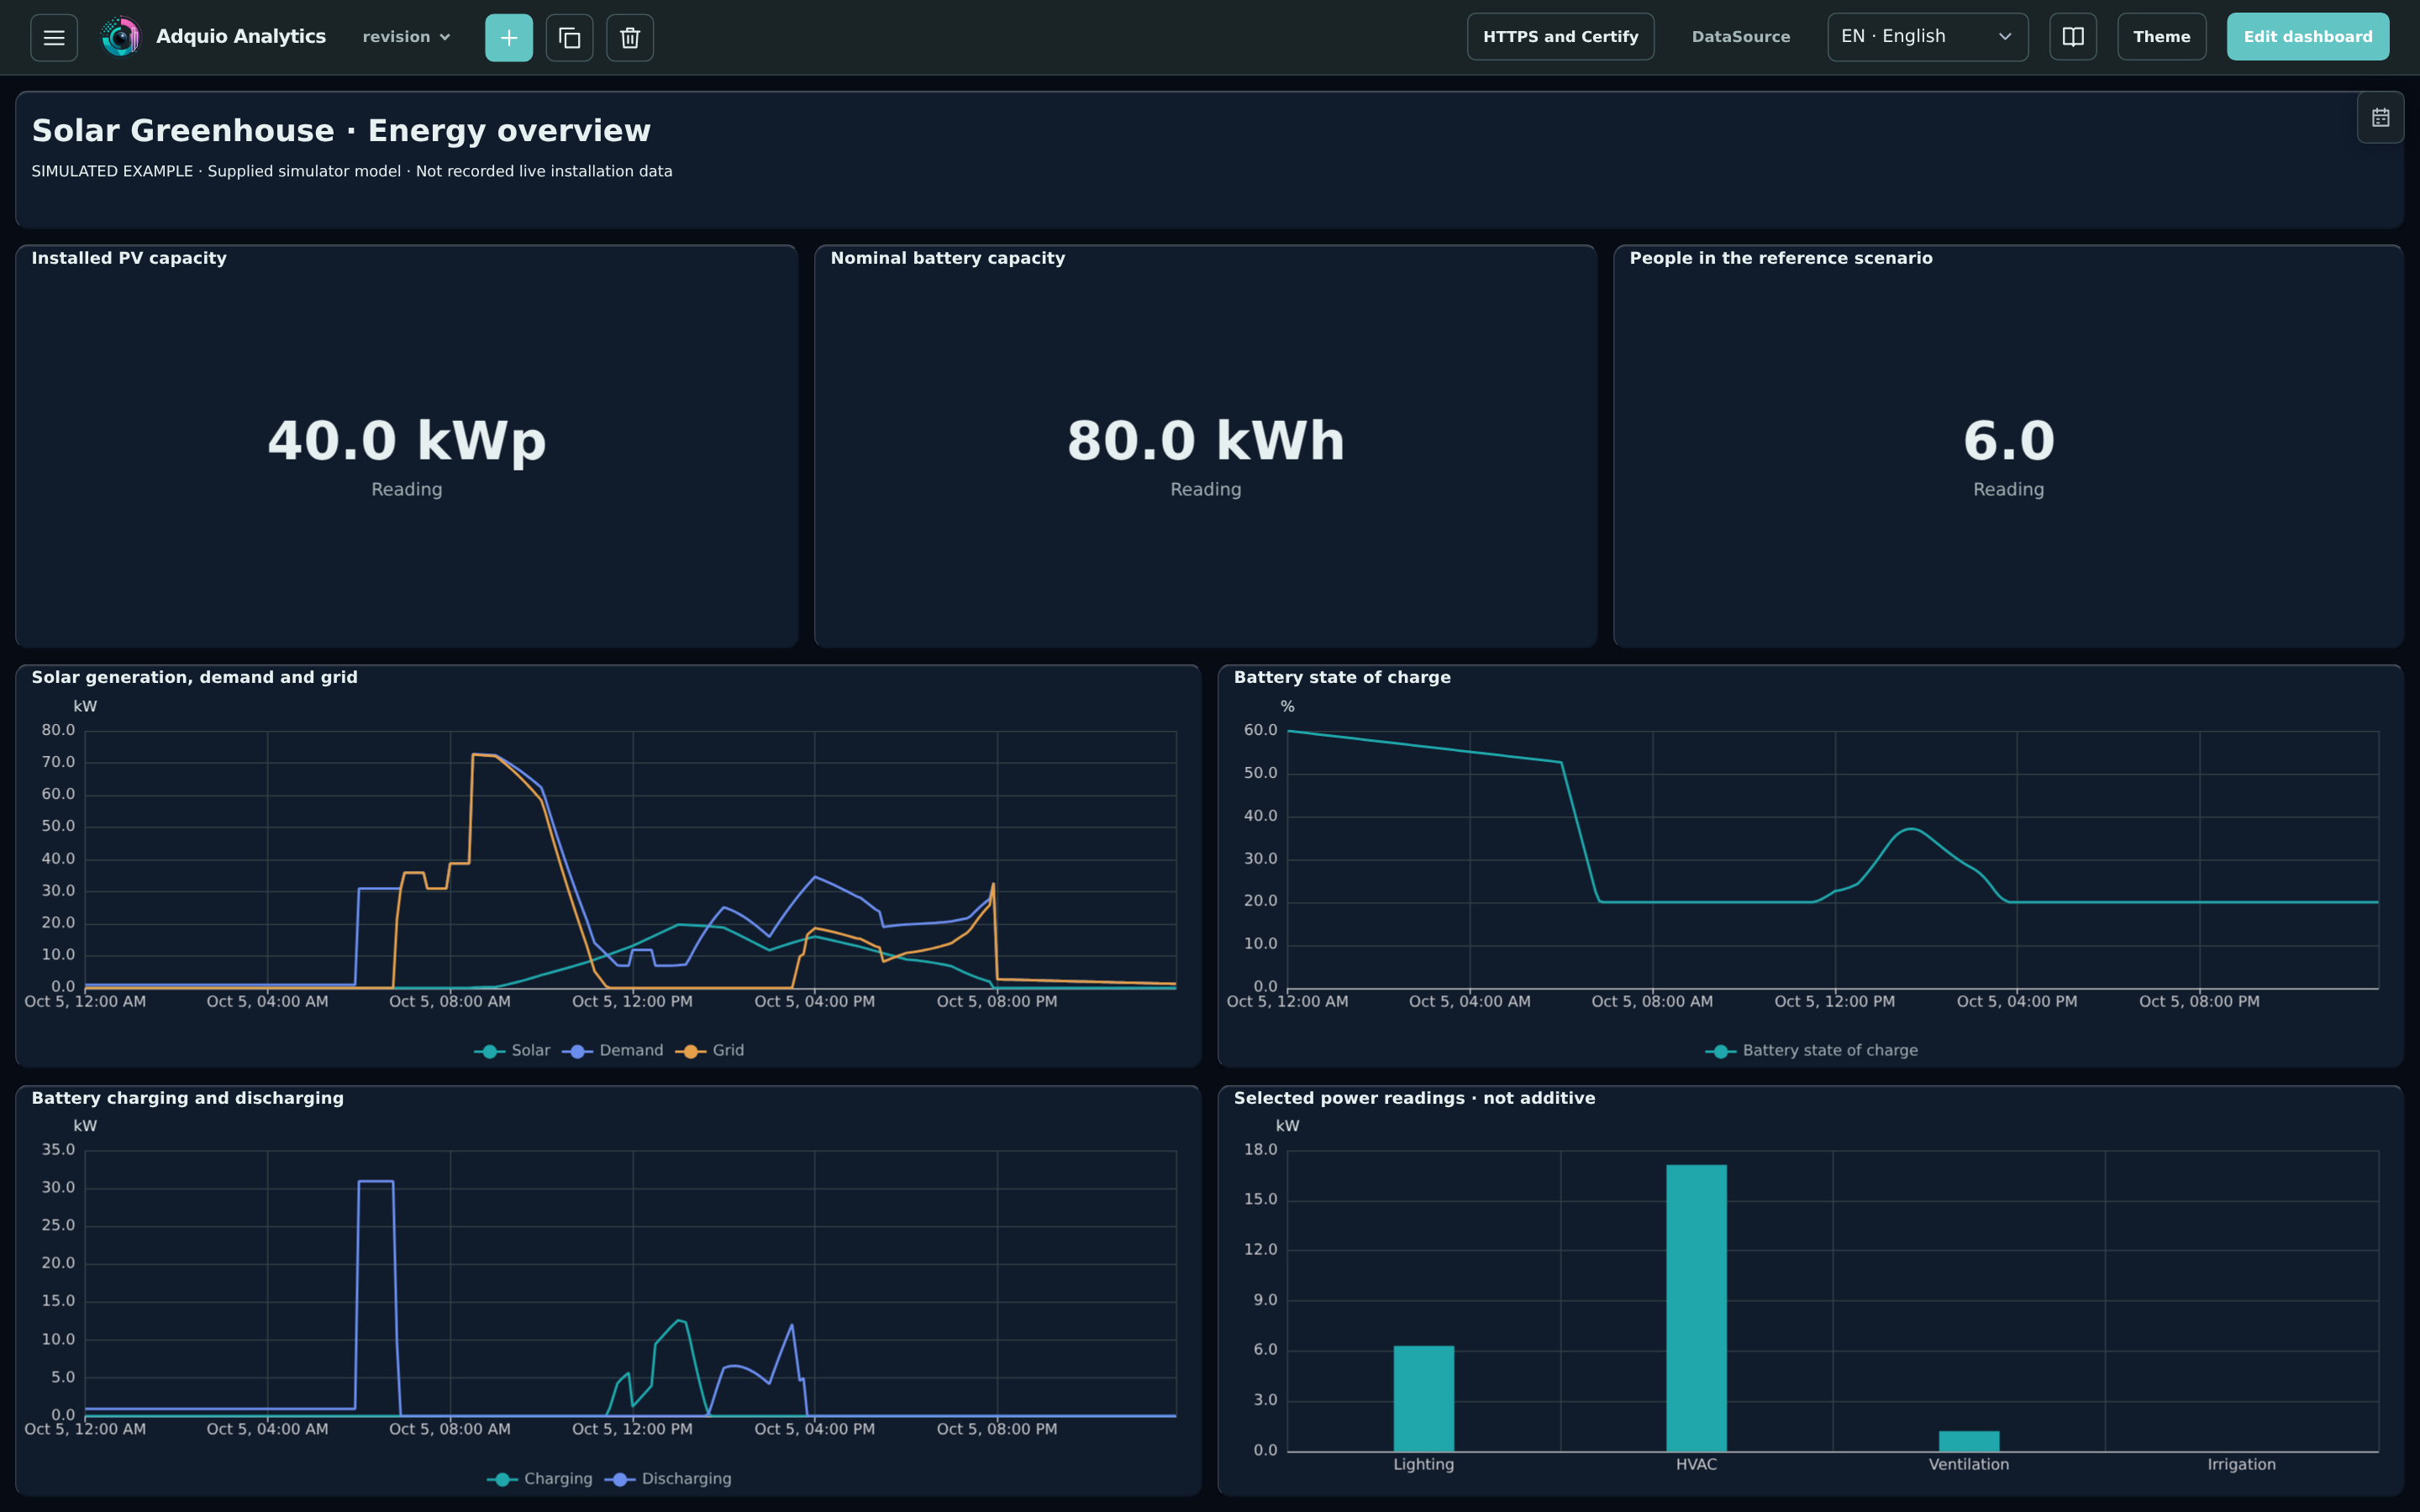
Energy overview
Read solar production, demand, grid import and storage in relation to growing activity.
How to read it. Consider crop requirements before interpreting a change in consumption.
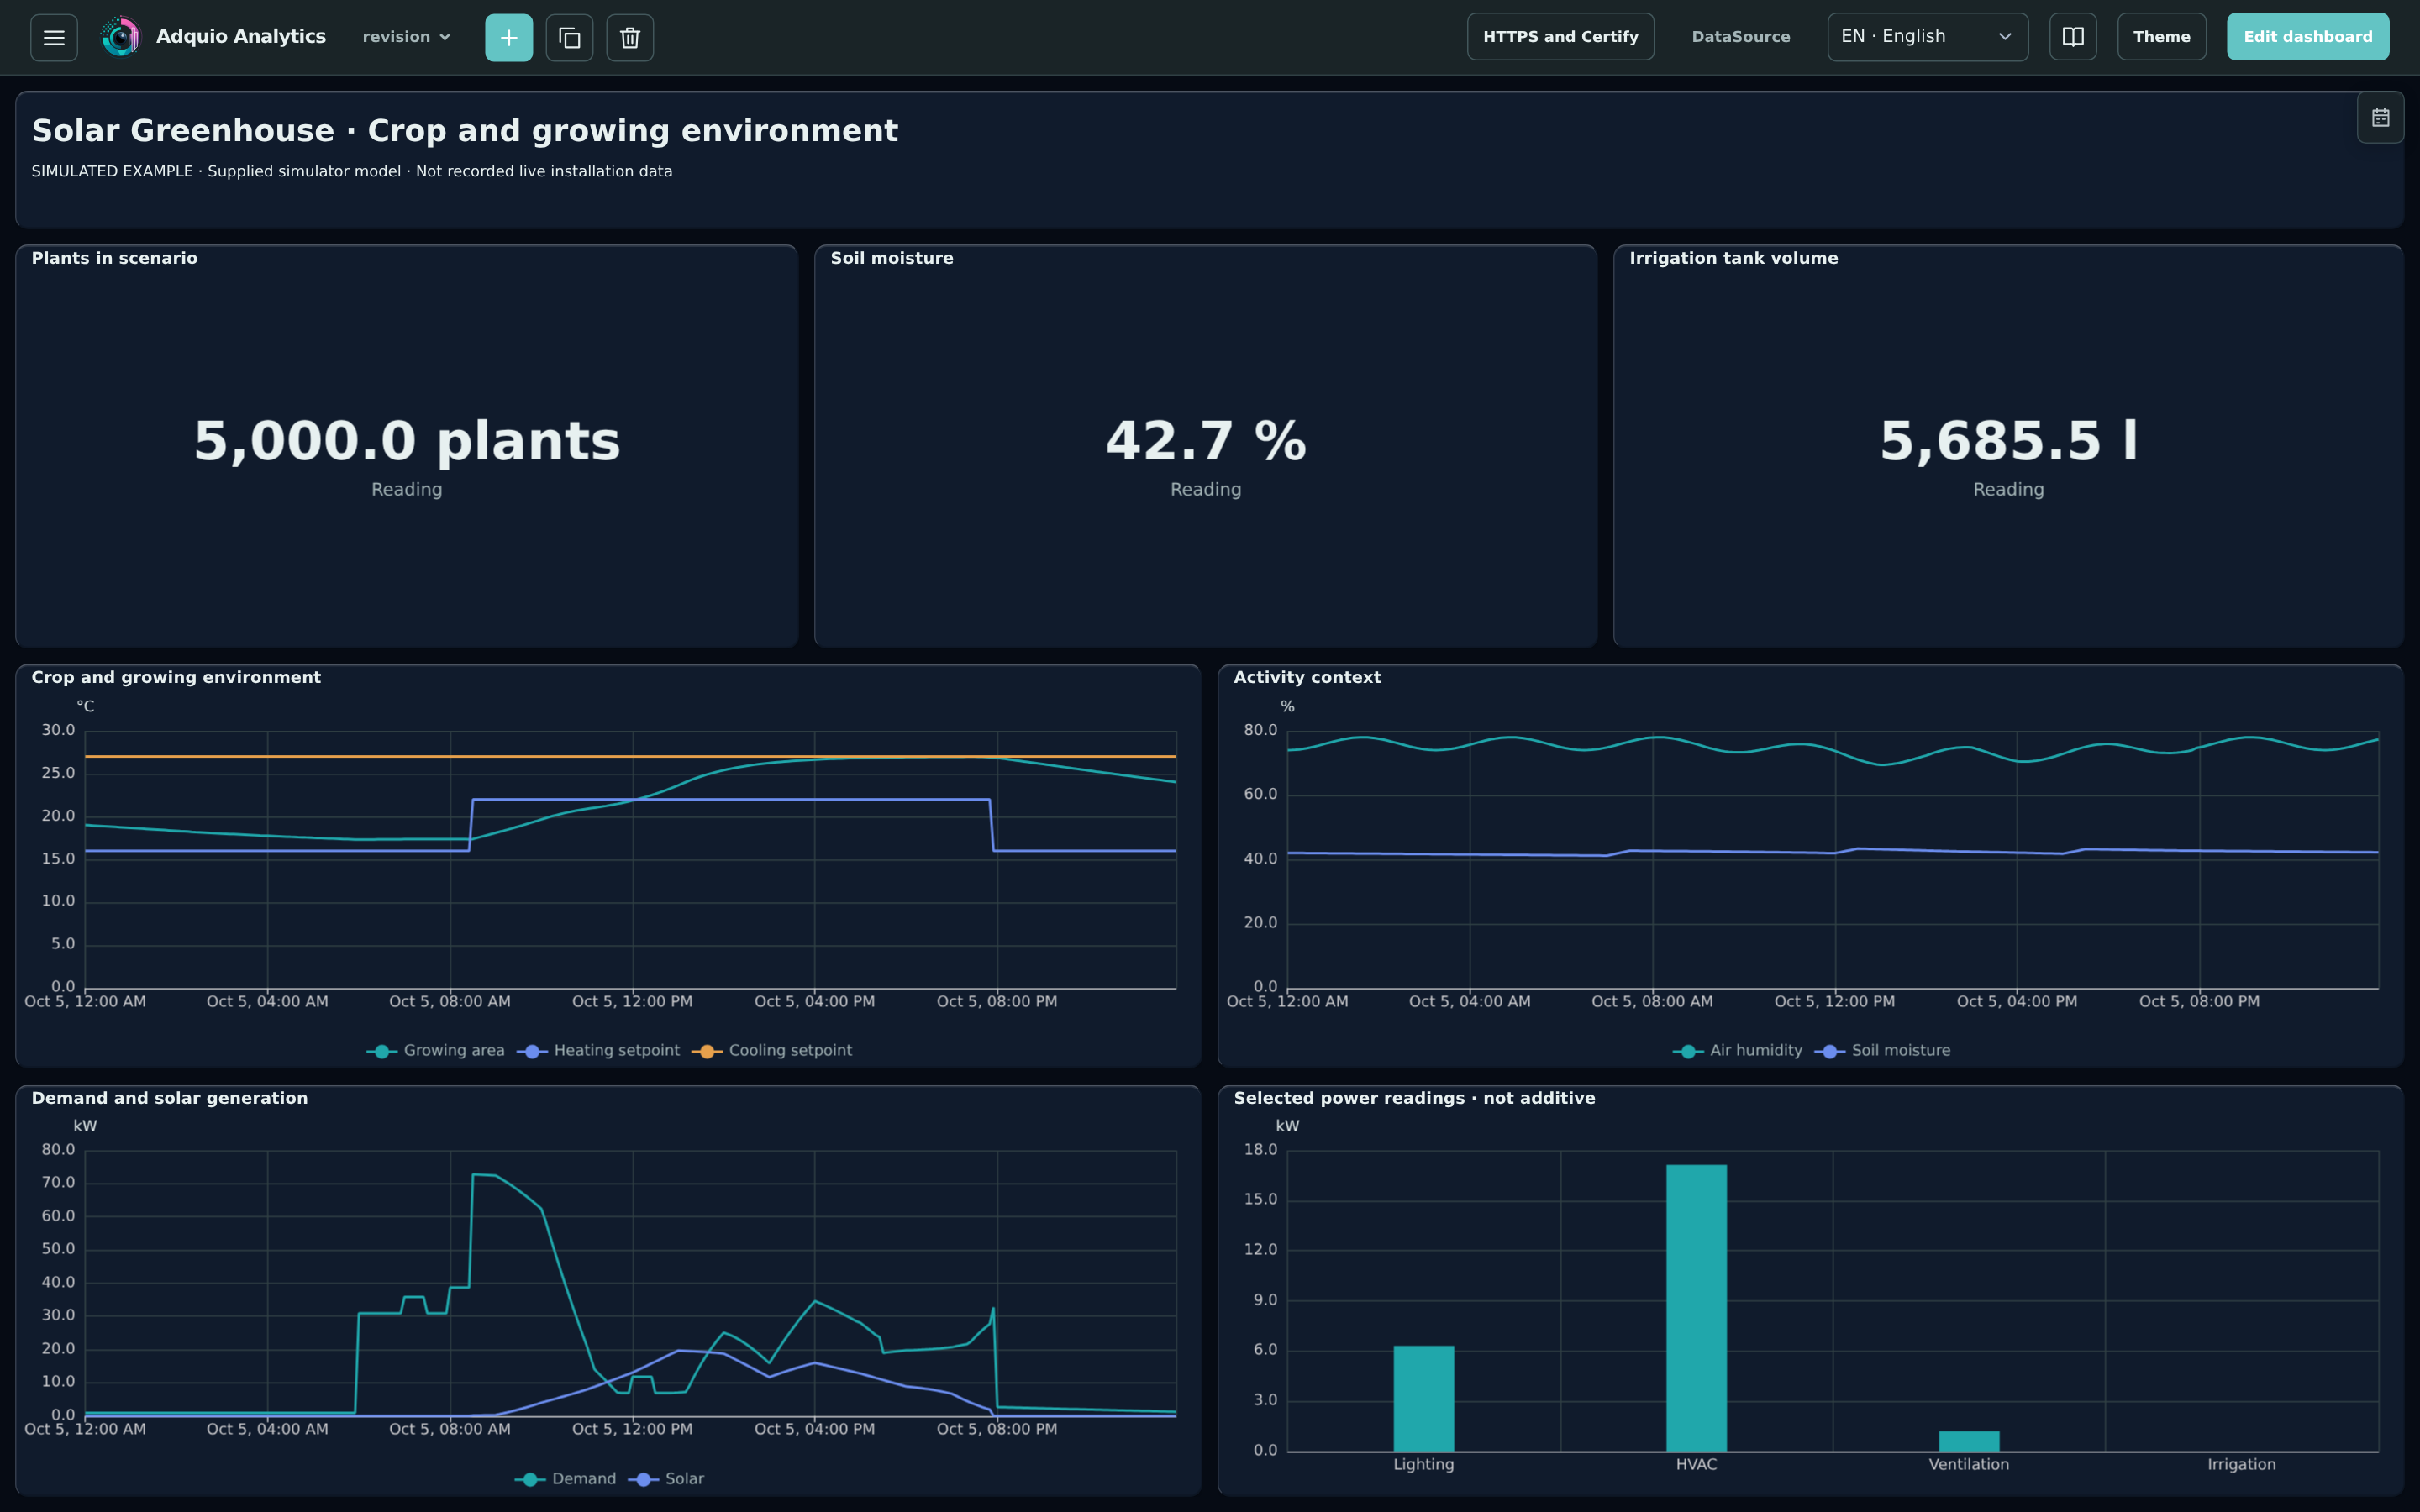
Crop and growing environment
Compare growing-area temperature with heating and cooling targets, alongside air humidity and soil moisture.
How to read it. Environmental targets depend on the crop and the project; the values are scenario assumptions.
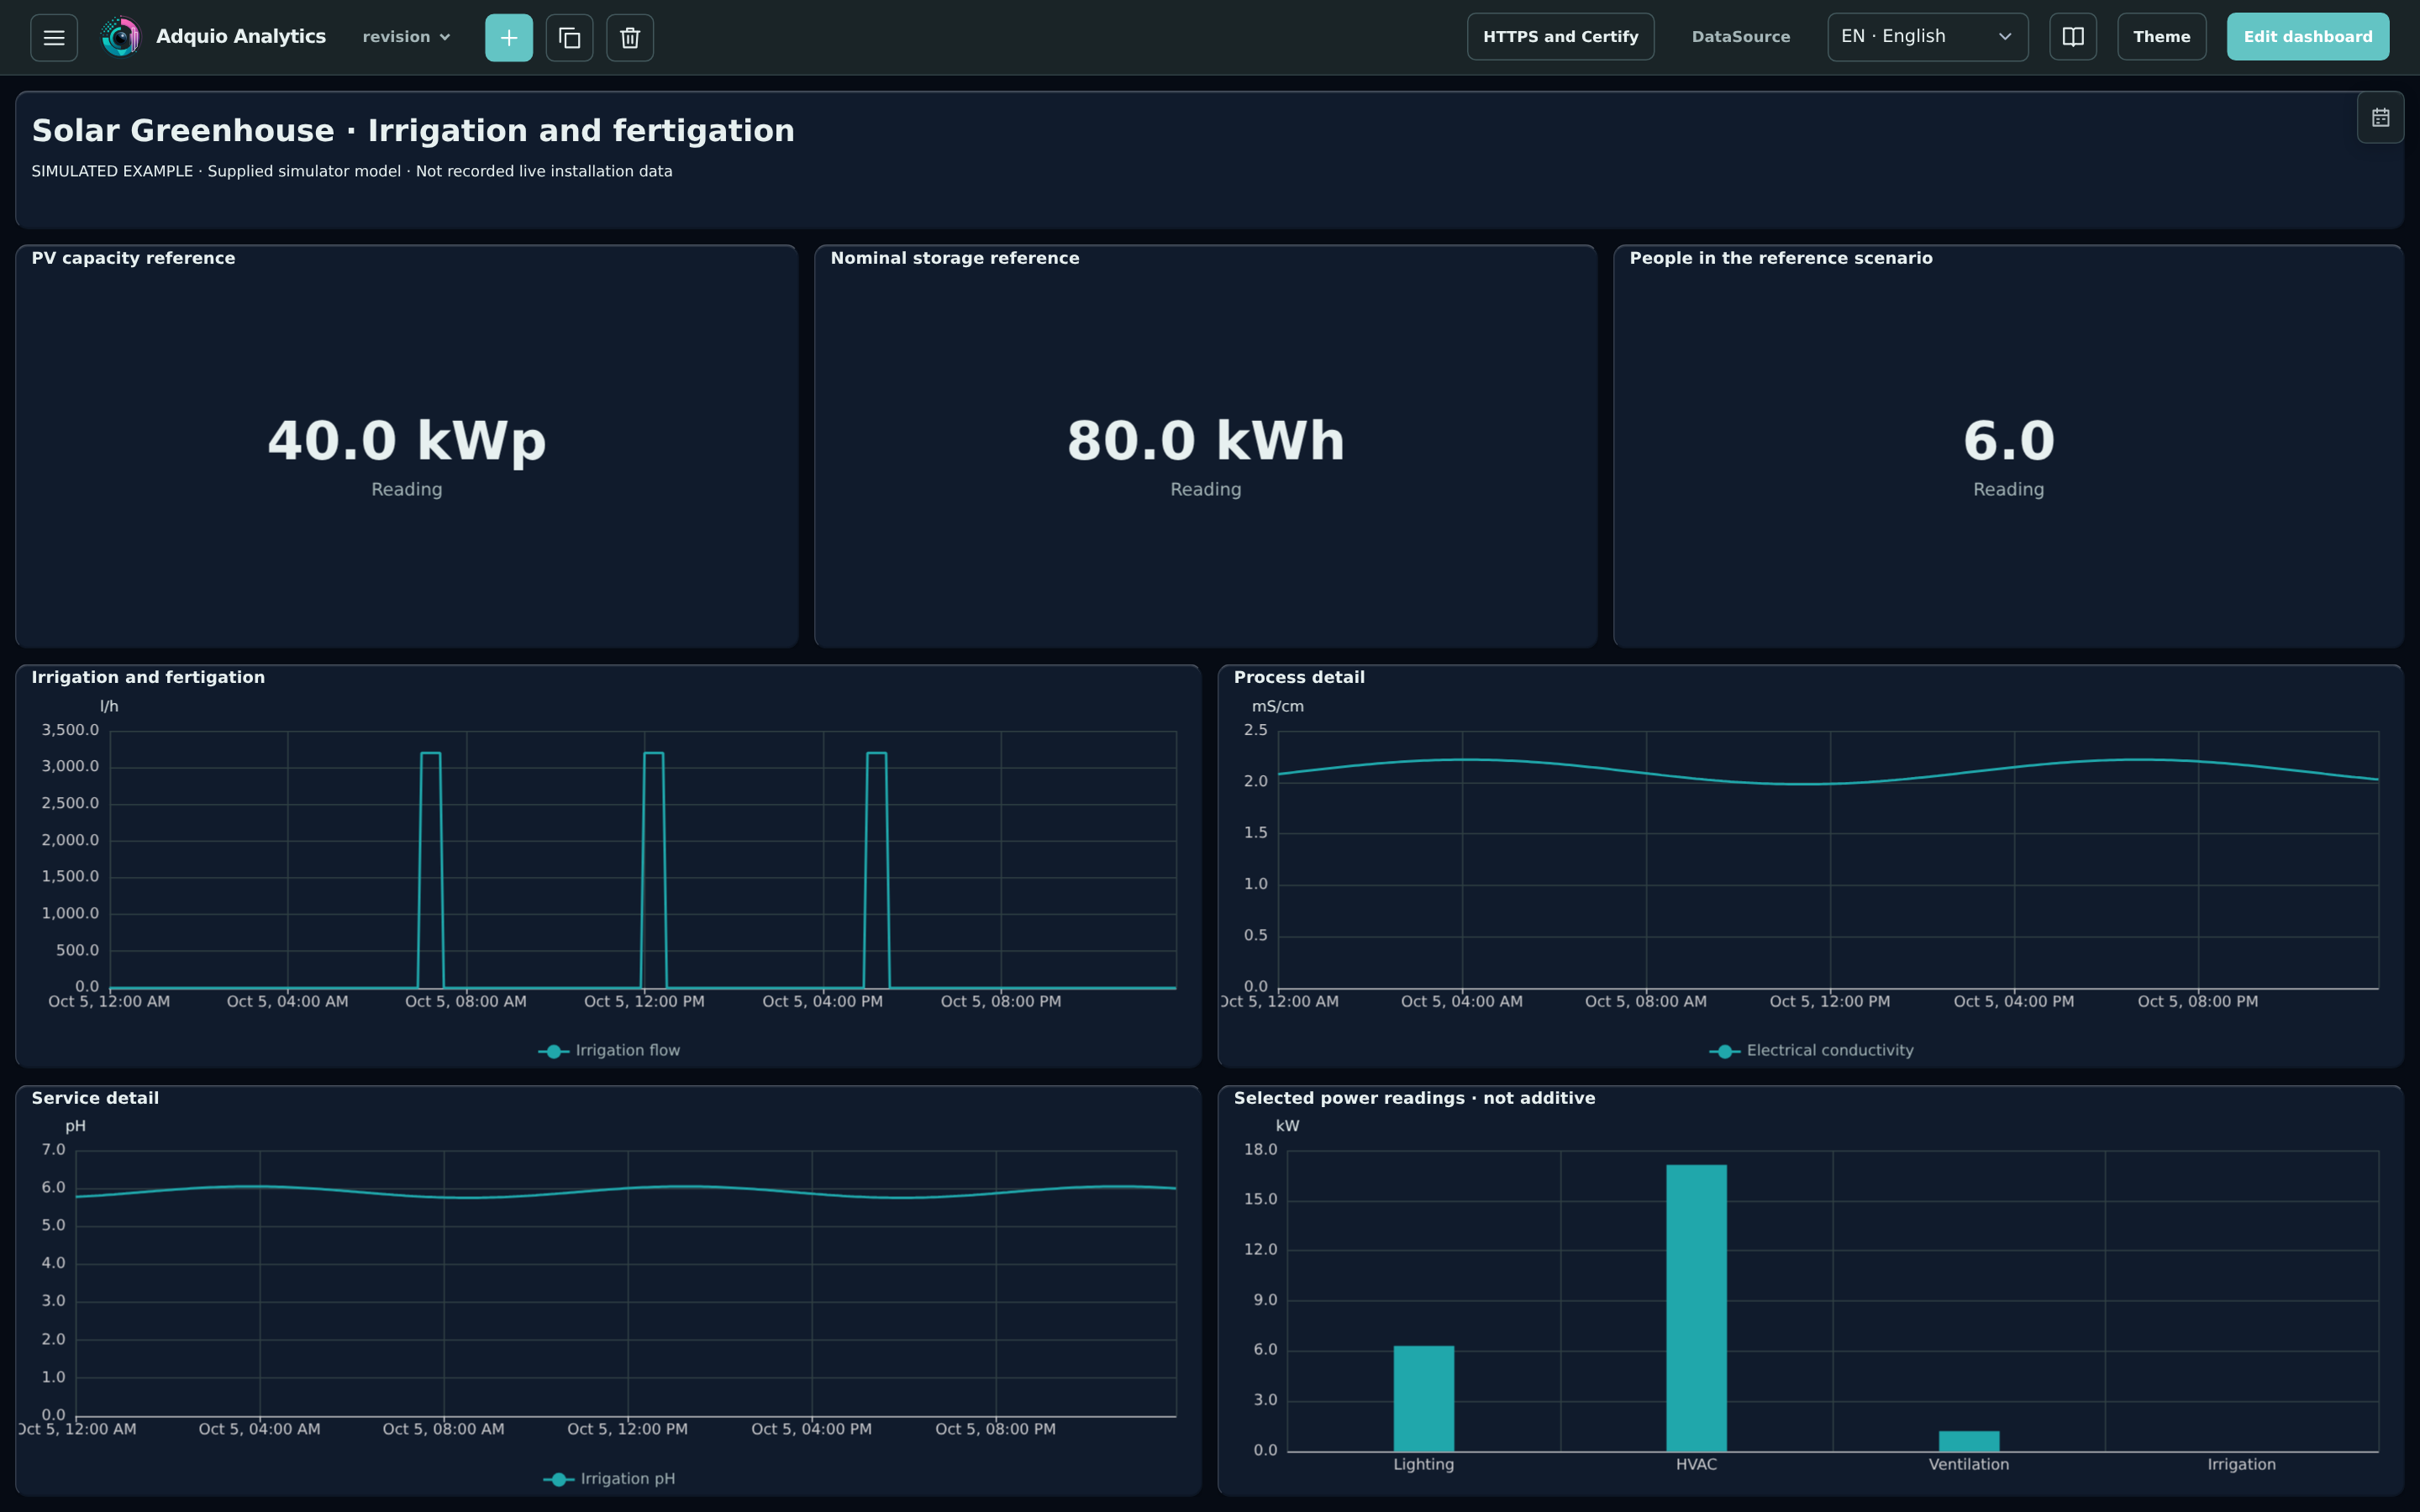
Irrigation and fertigation
Review irrigation flow, electrical conductivity and irrigation pH in separate panels.
How to read it. Compare cycles and investigate trends; simulated values are not universal agronomic recommendations.
These views were prepared in an isolated Analytics instance by running the supplied simulator. No connections or writes to real equipment were made. They are not recorded historical data from an installation.
From example to your installation
The same approach can be adapted to the variables and equipment available in your project. Start with the decision to support, then choose the appropriate measurements, units, periods and visualisations.
DataSource collects and prepares the data, and Adquio Analytics presents it in dashboards. Review measurement coverage and keep the same boundary when comparing days, areas or equipment.
The screenshots illustrate analytical possibilities. They do not verify savings, operational results or automatic control of equipment in this example.
What do you need to understand about your installation?
Tell us what you want to measure, compare or present, and we will help define a useful view for your team.