

ADQUIO ANALYTICS · 10 USE CASES
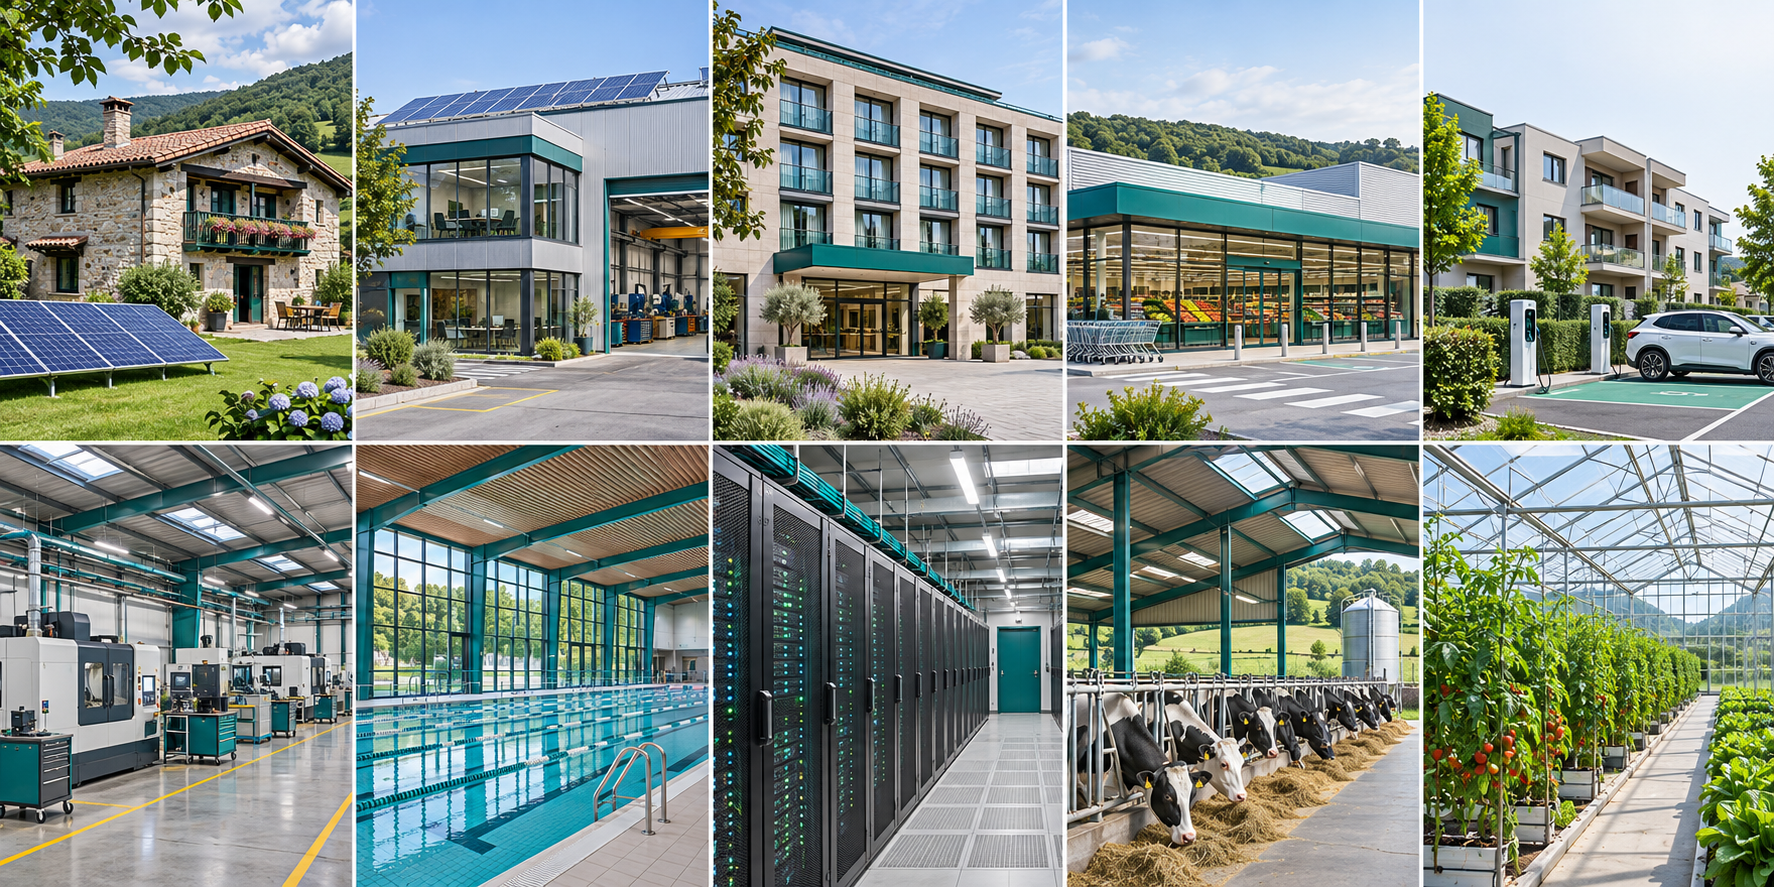
A home, a hotel and a factory ask different questions. Adquio Analytics provides a common way to explore their energy, comfort, activity and technical processes through dashboards.
This collection uses simulated scenarios and generated illustrations. Each linked article explains its technical assumptions and dashboards; it does not document verified customer results.
Start with a question, then build the view
A consumption curve becomes more useful when it is read alongside occupancy, opening hours or production. The aim is to connect each measure to the decision it can support, keeping units and time periods consistent.
DataSource collects and prepares the measurements. Analytics presents them as indicators, trends and comparisons so that each team can investigate its own operational questions.
Explore the ten examples
Choose an environment to see its technical reference, illustrated installation and explained dashboards. Inside each article, screenshots can be enlarged to full screen.

Solar Home
A home can generate, store and use electricity in many different ways. The useful question is how those processes fit together throughout the day.
Technical reference: 4 people · 90 m²; the architectural illustration was subsequently enlarged
Dashboards: Energy overview, Indoor climate, Estimated energy costs

Solar Office
An office with a workshop and a research lab does not stop using energy at the end of the working day. Servers, test benches and technical loads need their own context.
Technical reference: 760 m² · 20 engineers · 10 administration · 6 workshop · 3 R&D: 39 people
Dashboards: Energy overview, Comfort and indoor air

Solar Hotel
Energy tells only part of a hotel’s story. Occupied rooms and the services in operation provide the context needed to interpret it.
Technical reference: 4200 m² · 28 people
Dashboards: Energy overview, Occupancy and services, Hot water, water and laundry

Solar Supermarket
A supermarket continues to use energy after its doors close. Refrigeration, opening hours and customer activity need to be interpreted together.
Technical reference: 1200 m² · 24 people
Dashboards: Energy overview, Trading activity, Cold chain

Solar Residential Community
A residential community’s energy serves more than its homes: lifts, pumps, parking and electric vehicle charging are part of the same picture.
Technical reference: 3800 m² · 1 people
Dashboards: Energy overview, Homes and solar allocation, EV charging and shared services

Solar Factory
Higher consumption can mean more production, an idle machine or an auxiliary service that needs attention. Industrial context changes the interpretation.
Technical reference: 3500 m² · 48 people
Dashboards: Energy overview, Production and OEE, Compressed air and machinery

Solar Sports Centre
A pool needs to maintain its conditions as attendance changes. A sports centre must balance service, comfort and technical demand.
Technical reference: 3000 m² · 22 people
Dashboards: Energy overview, Sports use and services, Swimming pool, water and hot water

Solar Data Centre
In a data centre, electricity powers both the servers’ work and the conditions that keep them operating.
Technical reference: 350 m² · 6 people
Dashboards: Energy overview, IT load and communications, PUE, cooling and UPS

Solar Dairy Farm
Milking, milk storage and ventilation follow different rhythms. Understanding them together gives energy use its operational context.
Technical reference: 2800 m² · 8 people
Dashboards: Energy overview, Production and milking, Milk storage and animal environment

Solar Greenhouse
Reducing greenhouse consumption without looking at the crop leaves the most important part of the decision out of view.
Technical reference: 2000 m² · 6 people
Dashboards: Energy overview, Crop and growing environment, Irrigation and fertigation
What these examples teach us
The same platform can answer very different questions when the data has the right context. Energy is related to activity, environmental conditions to occupancy, and process variables to the service that the installation must provide.
The starting point is the available variables, a clear question and a dashboard that explains the answer. The examples illustrate analytical possibilities rather than guaranteed savings or certified operational performance.
What would you like to understand about your installation?
Tell us what you want to measure, compare or present, and explore how Adquio Analytics could support your team.


