ADQUIO ANALYTICS · USE CASES
A home can generate, store and use electricity in many different ways. The useful question is how those processes fit together throughout the day.
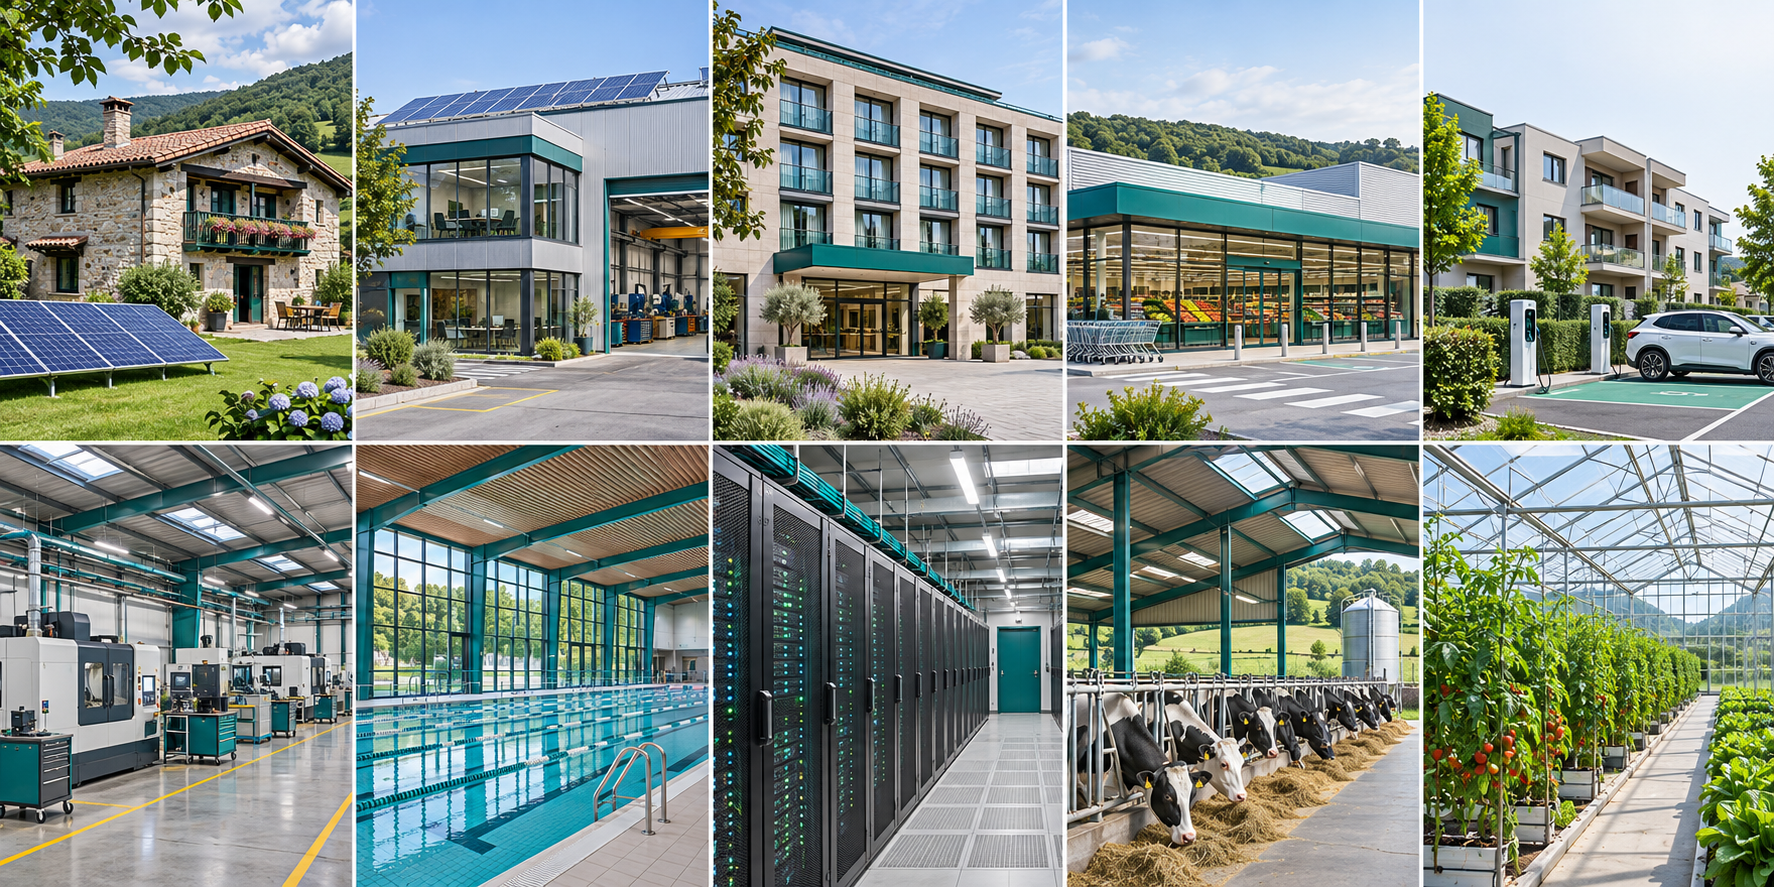
This article presents a use case with simulated data. The main image is a generated illustration; the screenshots show the Adquio Analytics interface.
The scenario: Solar Home
This example combines solar self-consumption, battery storage, hot water, cooking, appliances and lighting in a home occupied by four people. Heating includes a wood-fired thermal contribution, and each room has its own behaviour.
Analytics relates daily routines to available energy, compares indoor and outdoor conditions and separates the contribution of solar generation, storage and the grid.
Questions this example helps answer
Visualisations become useful when they support a specific decision. This example helps explore the following questions:
When could a load be shifted towards solar generation hours?
How much battery reserve remains, and how does it change overnight?
Which rooms behave differently in terms of comfort?
Technical reference for the example
These values define the reference scenario. They are simulation parameters, not a specification for a verified customer installation.
| Parameter | Model reference |
|---|---|
| Model occupancy | 4 people |
| Energy model floor area | 90 m²; the architectural illustration was subsequently enlarged |
| Photovoltaics | 9 × 400 W modules · 3.6 kWp · south-facing · 35° tilt |
| Hybrid inverter | Combined PV and battery-discharge limit: 5 kW |
| Storage | 48 V / 380 Ah · 18.24 kWh nominal · approximately 16.42 kWh usable |
| Limits and efficiency | 10–100% SOC · 95% efficiency in each direction |
| Battery charging | Solar only; no grid charging |
| Model rooms | Living room, kitchen, two bedrooms and one bathroom |
| Variable update interval | 30 seconds |
| Weather and forecasts | Weather forecasts refreshed hourly · model forecasts every 10 minutes |
The newest image was selected by modification date. Its enlarged architecture and second bathroom are illustrative; the original energy model still represents 90 m² and one bathroom.
The dashboards, explained
Each view answers a different question. Select a thumbnail to open a large image; use the viewer to move to the next dashboard or switch to full screen.
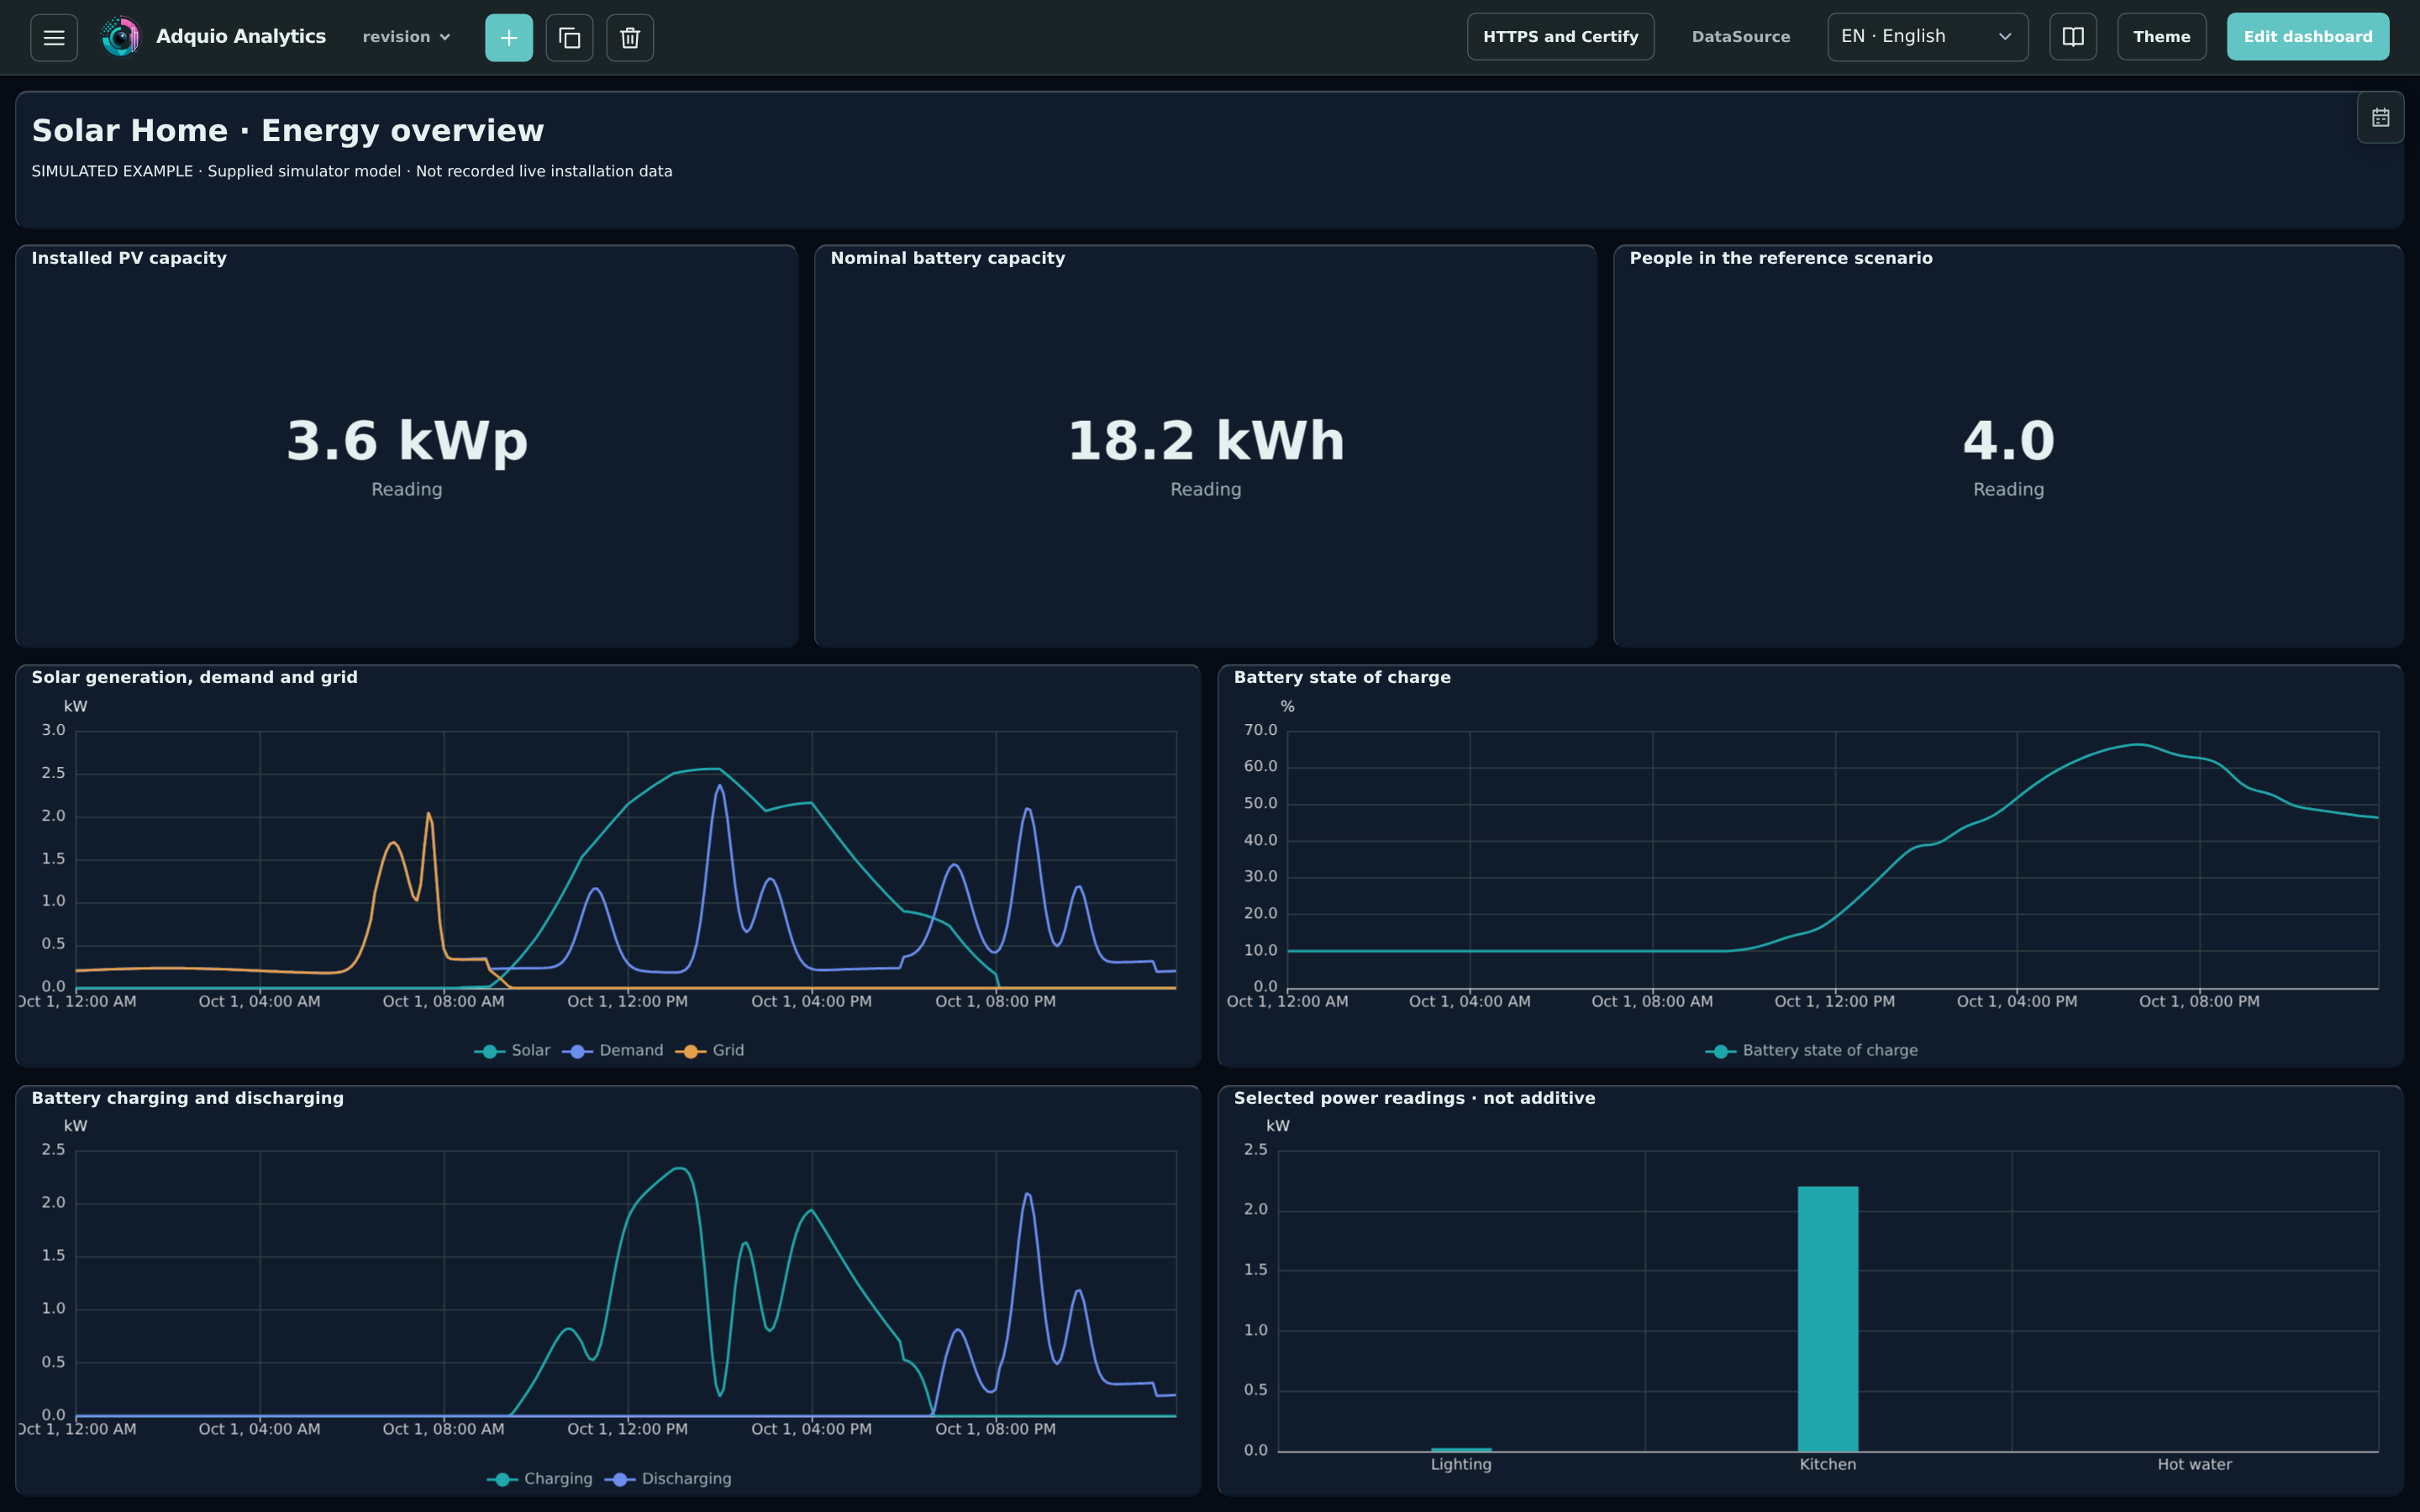
Energy overview
Compare solar generation, demand, grid import and storage. The curves and indicators show how supply changes through the simulated day.
How to read it. Use this view to explore load timing and distinguish instantaneous power from stored or accumulated energy.
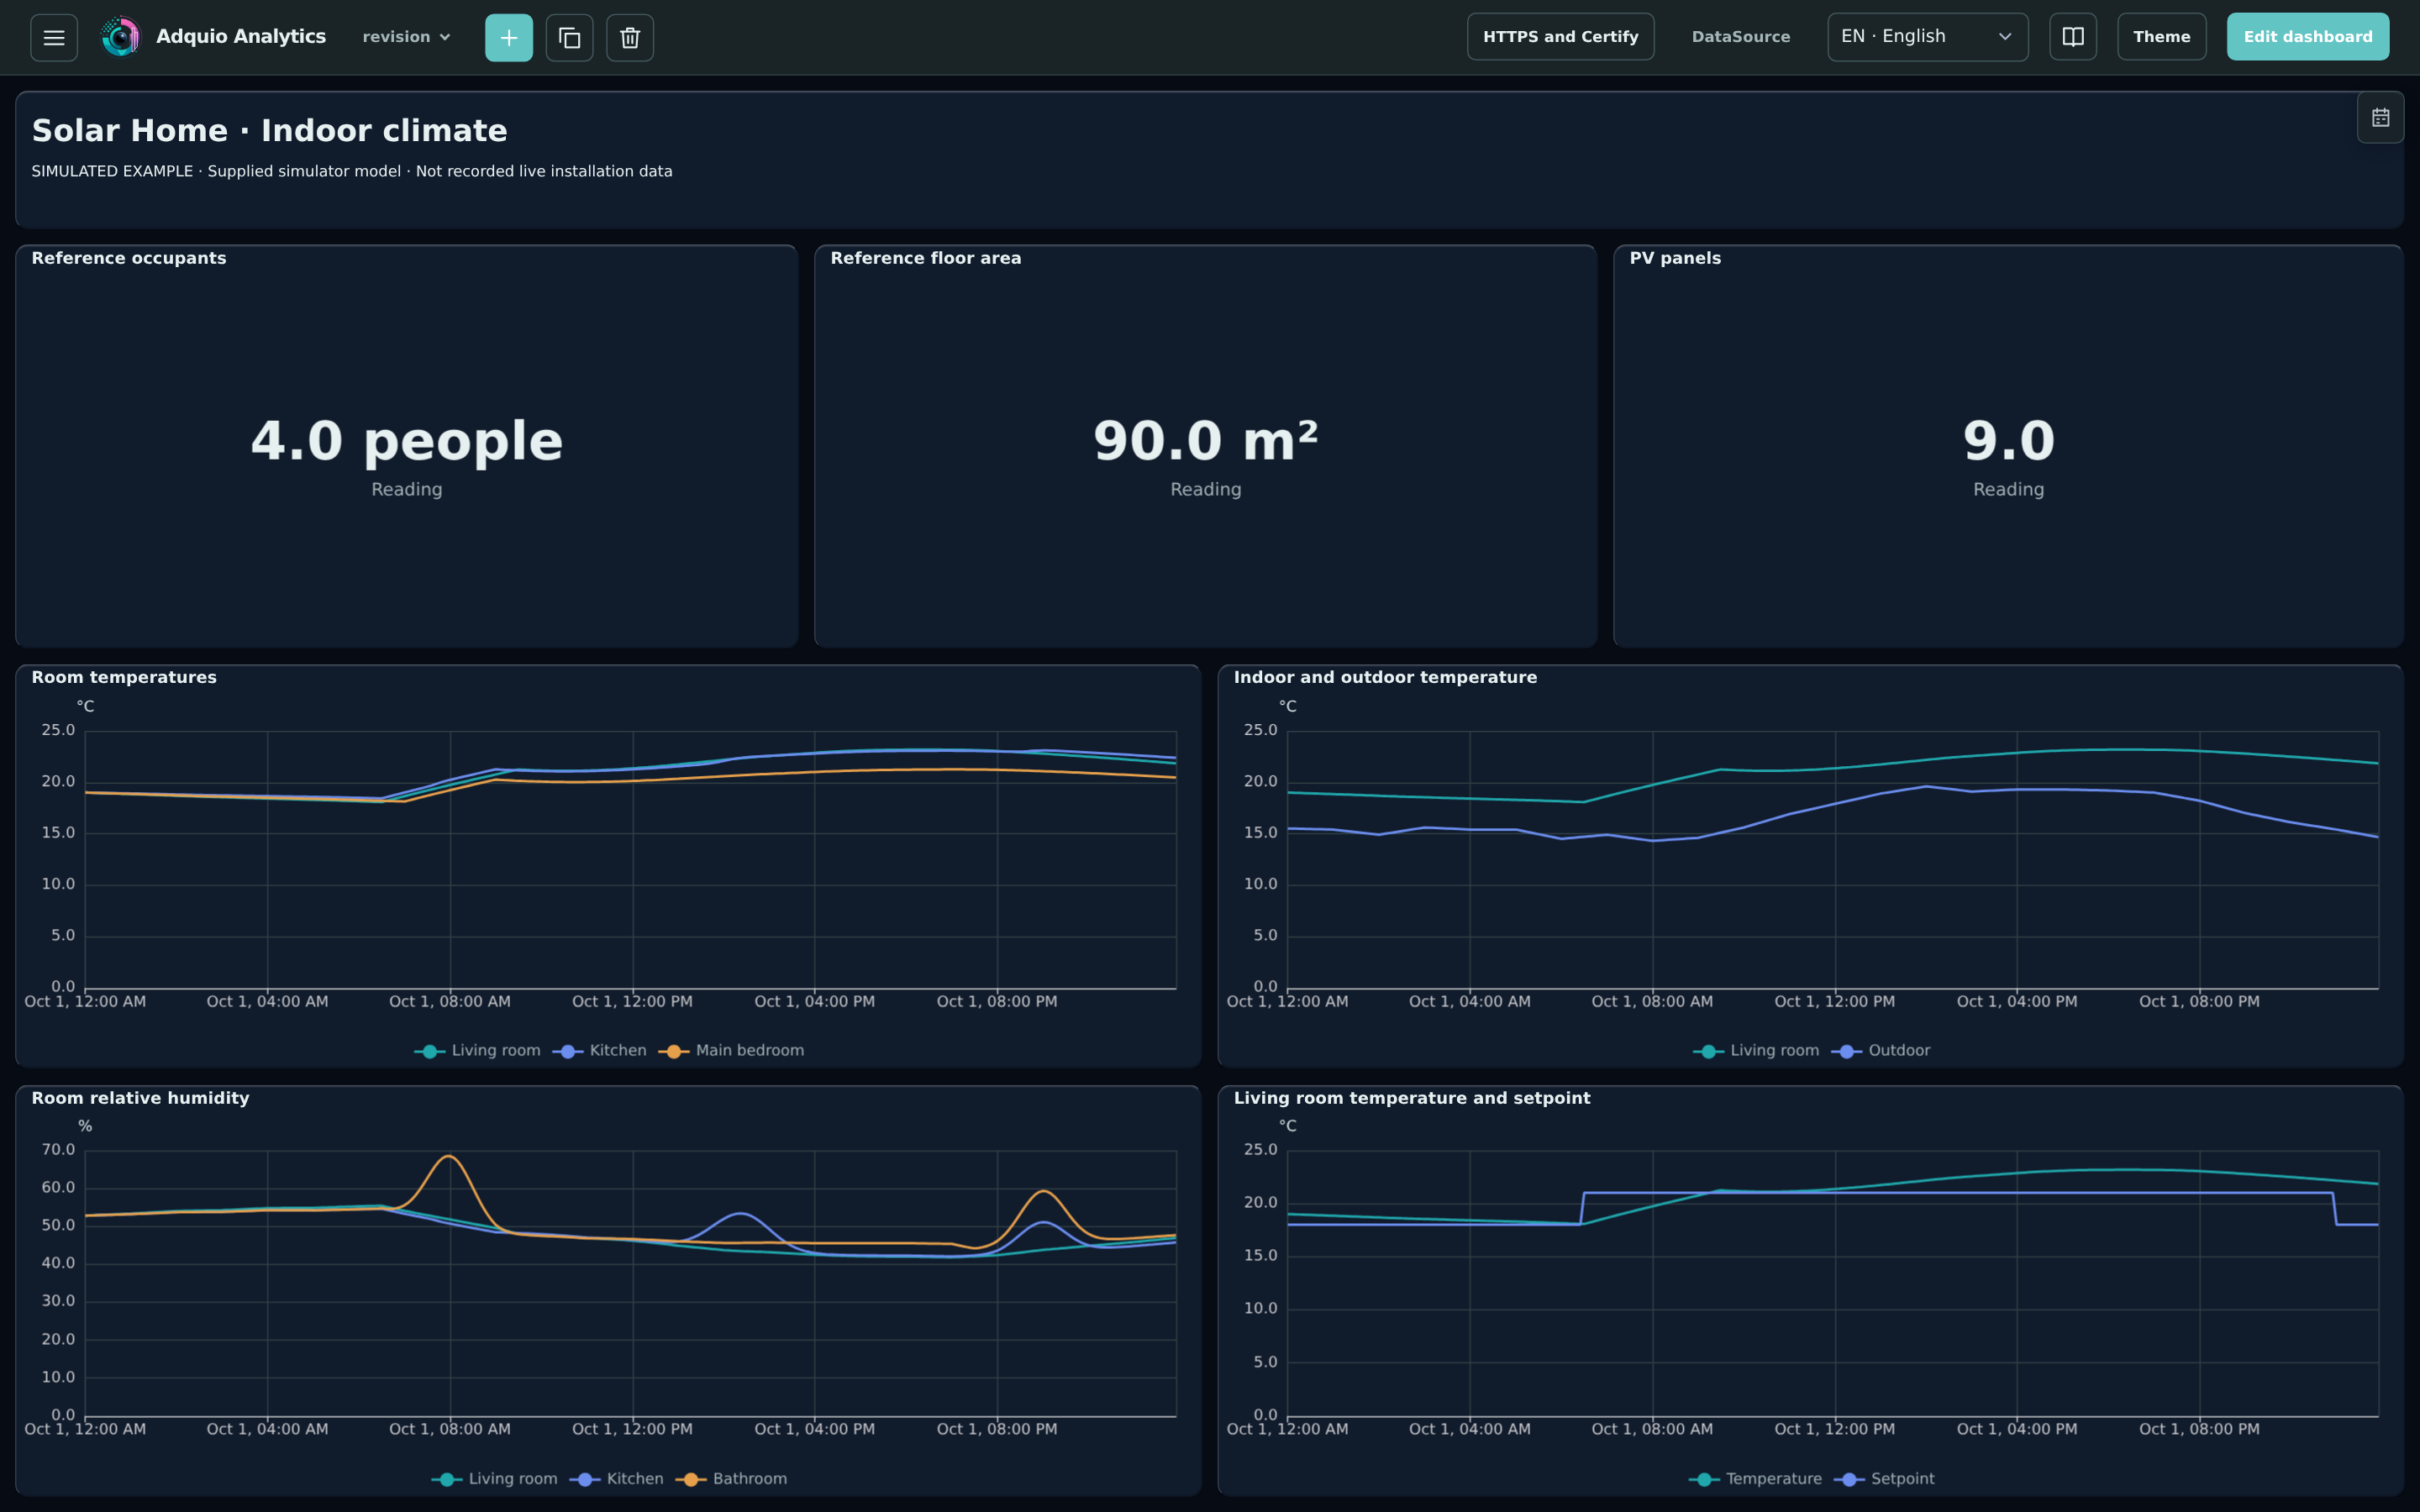
Indoor climate
Compare room temperatures, outdoor conditions, relative humidity and the living-room setpoint.
How to read it. Study differences between rooms rather than reducing comfort to a single building-wide average.
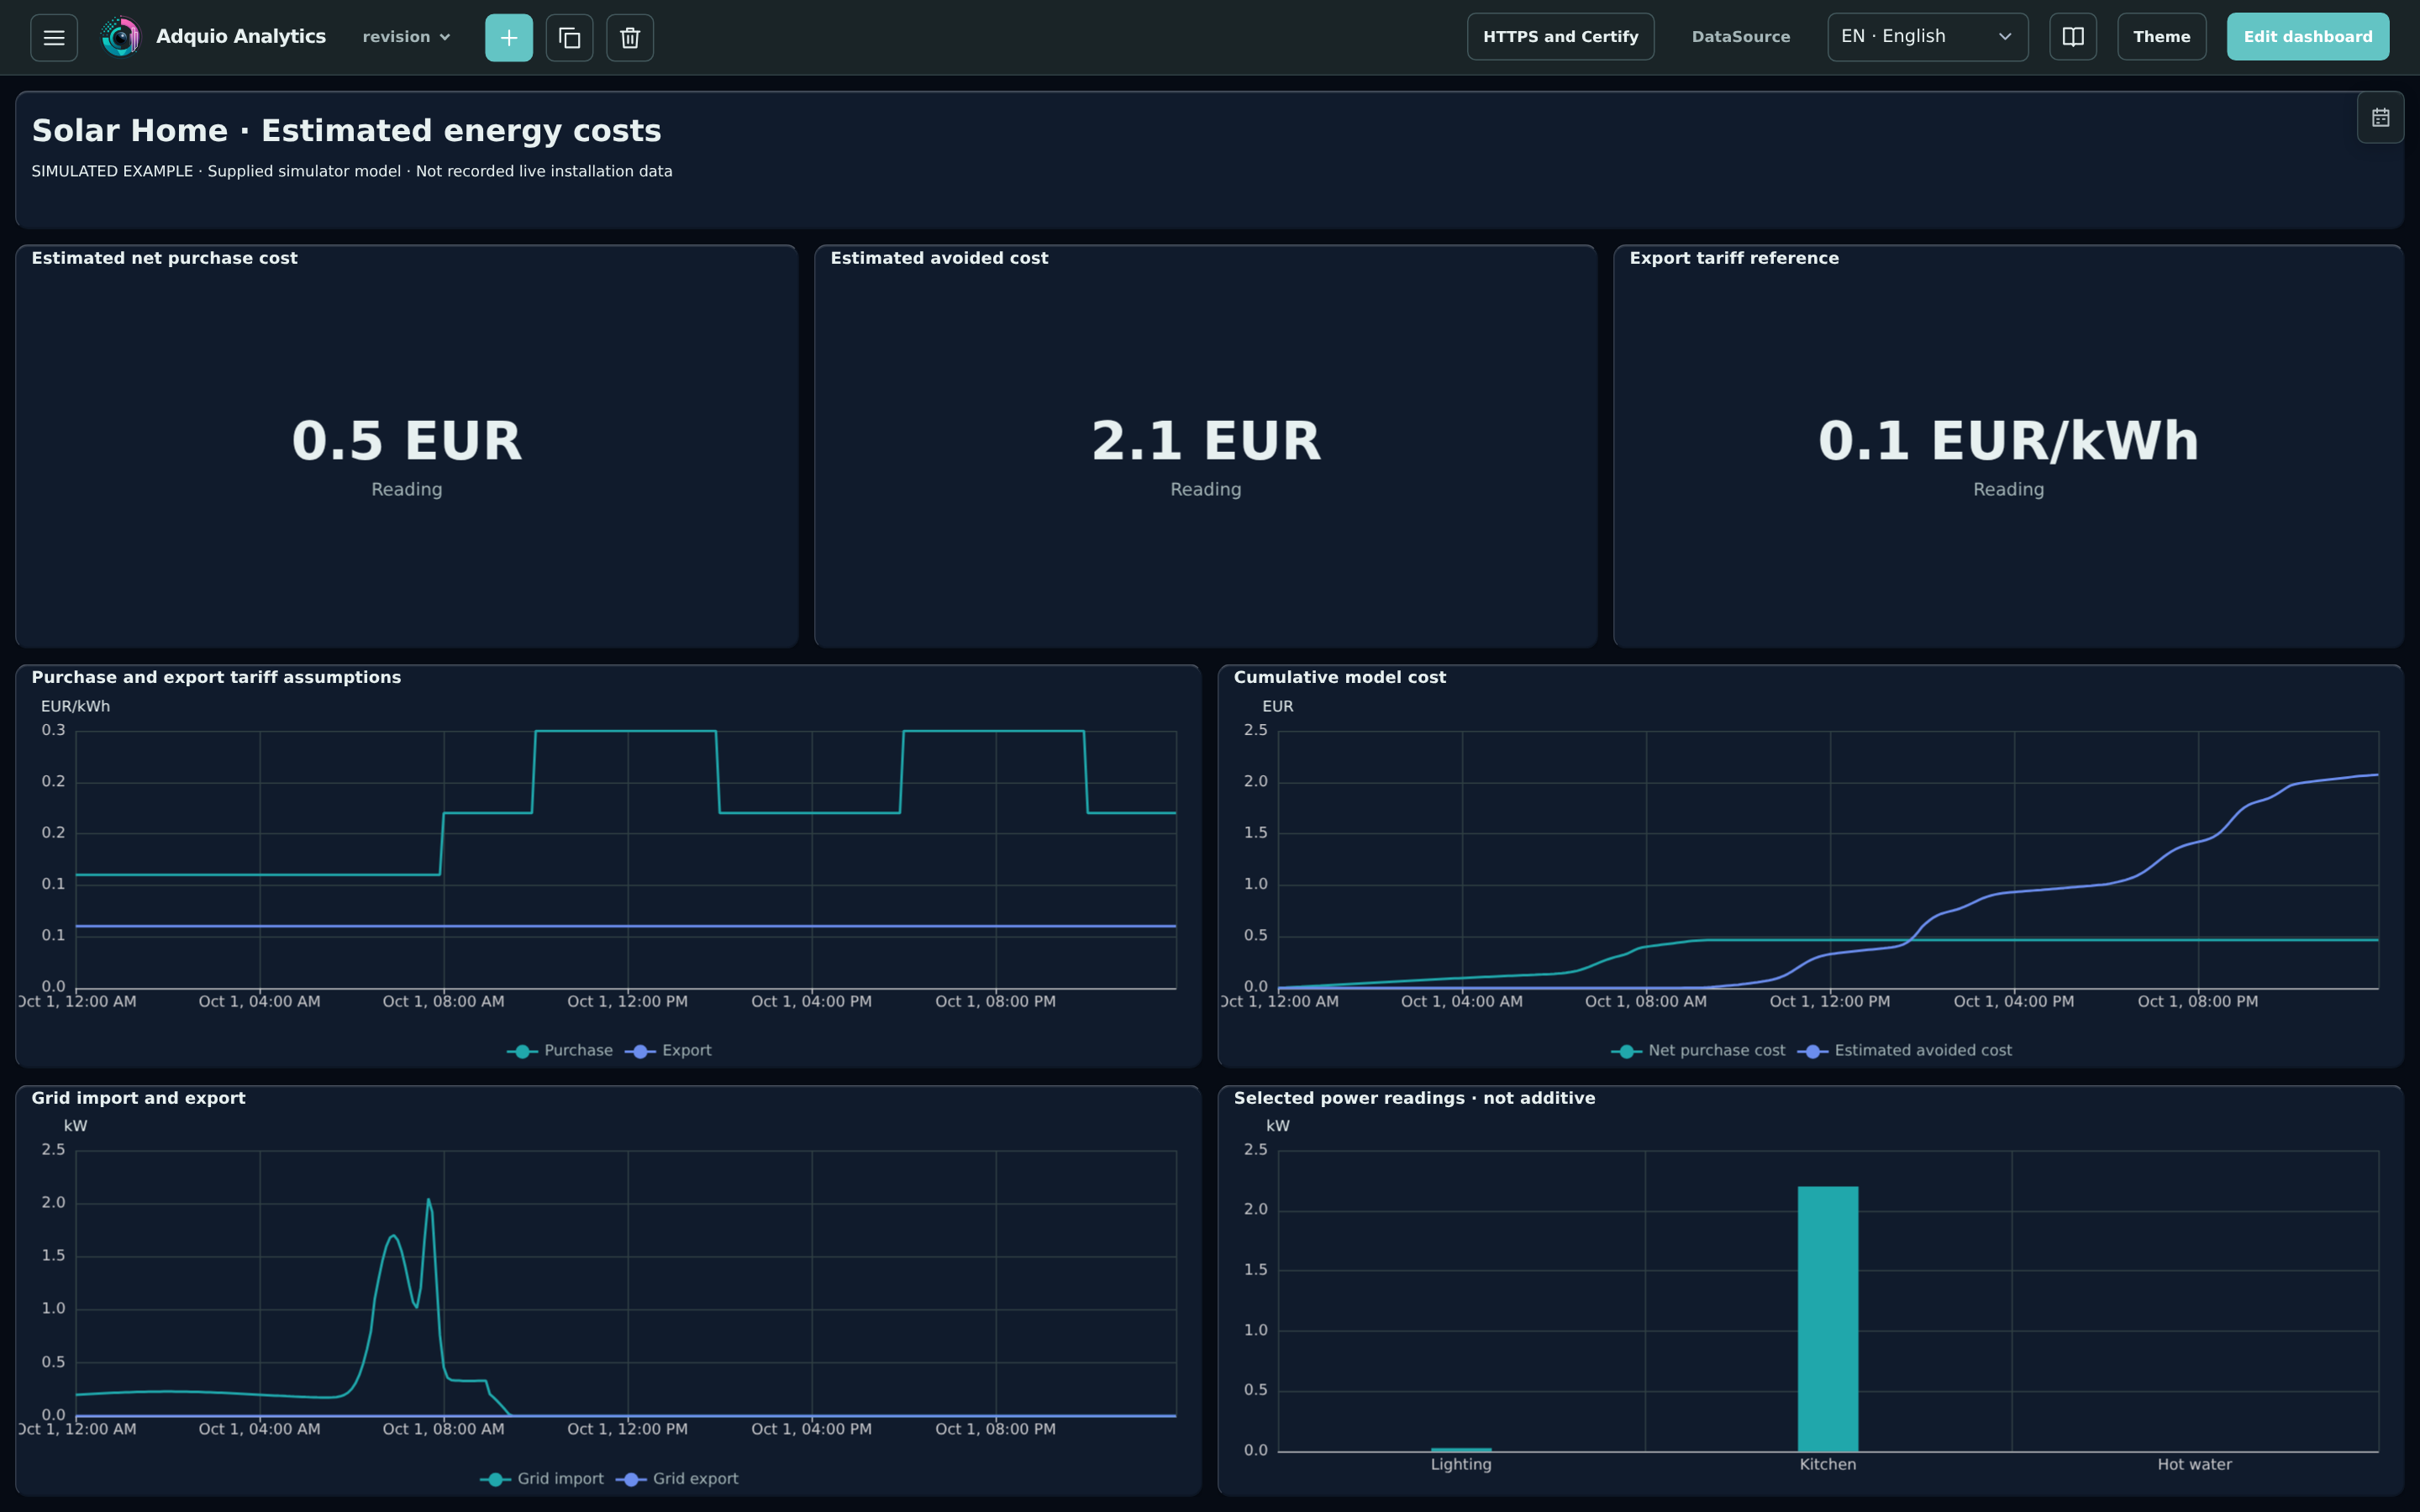
Estimated energy costs
Explore tariff assumptions, modelled net purchase cost, estimated avoided cost and grid import and export.
How to read it. These estimates exclude a full electricity bill, taxes, fixed charges and investment costs; they are not a return-on-investment calculation.
These views were prepared in an isolated Analytics instance by running the supplied simulator. No connections or writes to real equipment were made. They are not recorded historical data from an installation.
From example to your installation
The same approach can be adapted to the variables and equipment available in your project. Start with the decision to support, then choose the appropriate measurements, units, periods and visualisations.
DataSource collects and prepares the data, and Adquio Analytics presents it in dashboards. Review measurement coverage and keep the same boundary when comparing days, areas or equipment.
The screenshots illustrate analytical possibilities. They do not verify savings, operational results or automatic control of equipment in this example.
What do you need to understand about your installation?
Tell us what you want to measure, compare or present, and we will help define a useful view for your team.