Every time a light switches on, it uses energy. Every time it is dimmed, its consumption changes. And when it switches off, it stops using the energy needed for lighting, although some equipment still draws a small amount of standby power.
This happens constantly in offices, hotels, museums, shopping centres and thousands of buildings.
Yet there is something curious about it.
Although we know which lights we are switching on and off, we often do not know how much energy each one uses throughout the day.
An electricity bill tells us our total consumption, but it does not always answer simple questions such as:
- How much does it cost to light my hotel’s lobby?
- Which floor uses the most lighting energy?
- How much electricity do we save by dimming lights when enough daylight is available?
- How much energy do the luminaires use at night?
- How much money could we save by changing some schedules?
Answering these questions has often required metering equipment, additional wiring and a considerable investment.
What if we could obtain that information from data our lighting already generates?
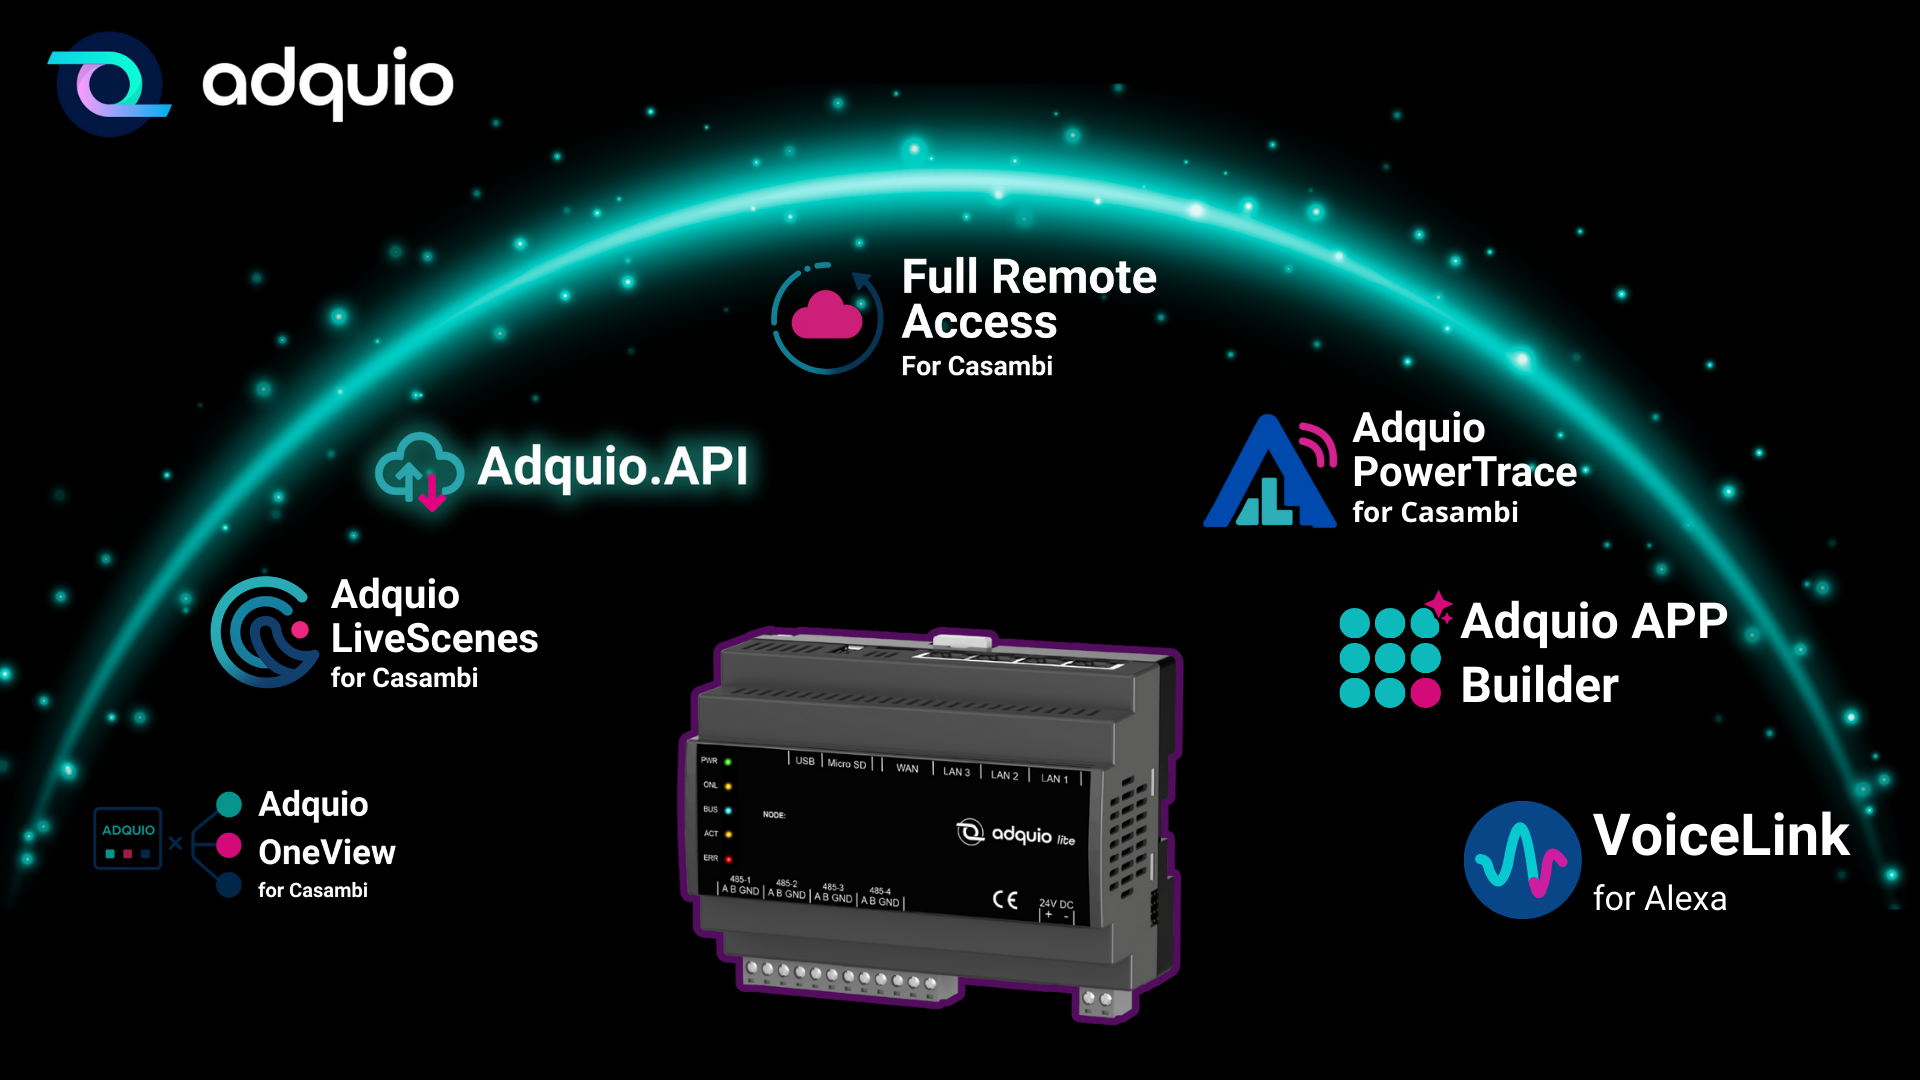
That is precisely what Adquio PowerTrace for Casambi enables.
First, what is Adquio PowerTrace?
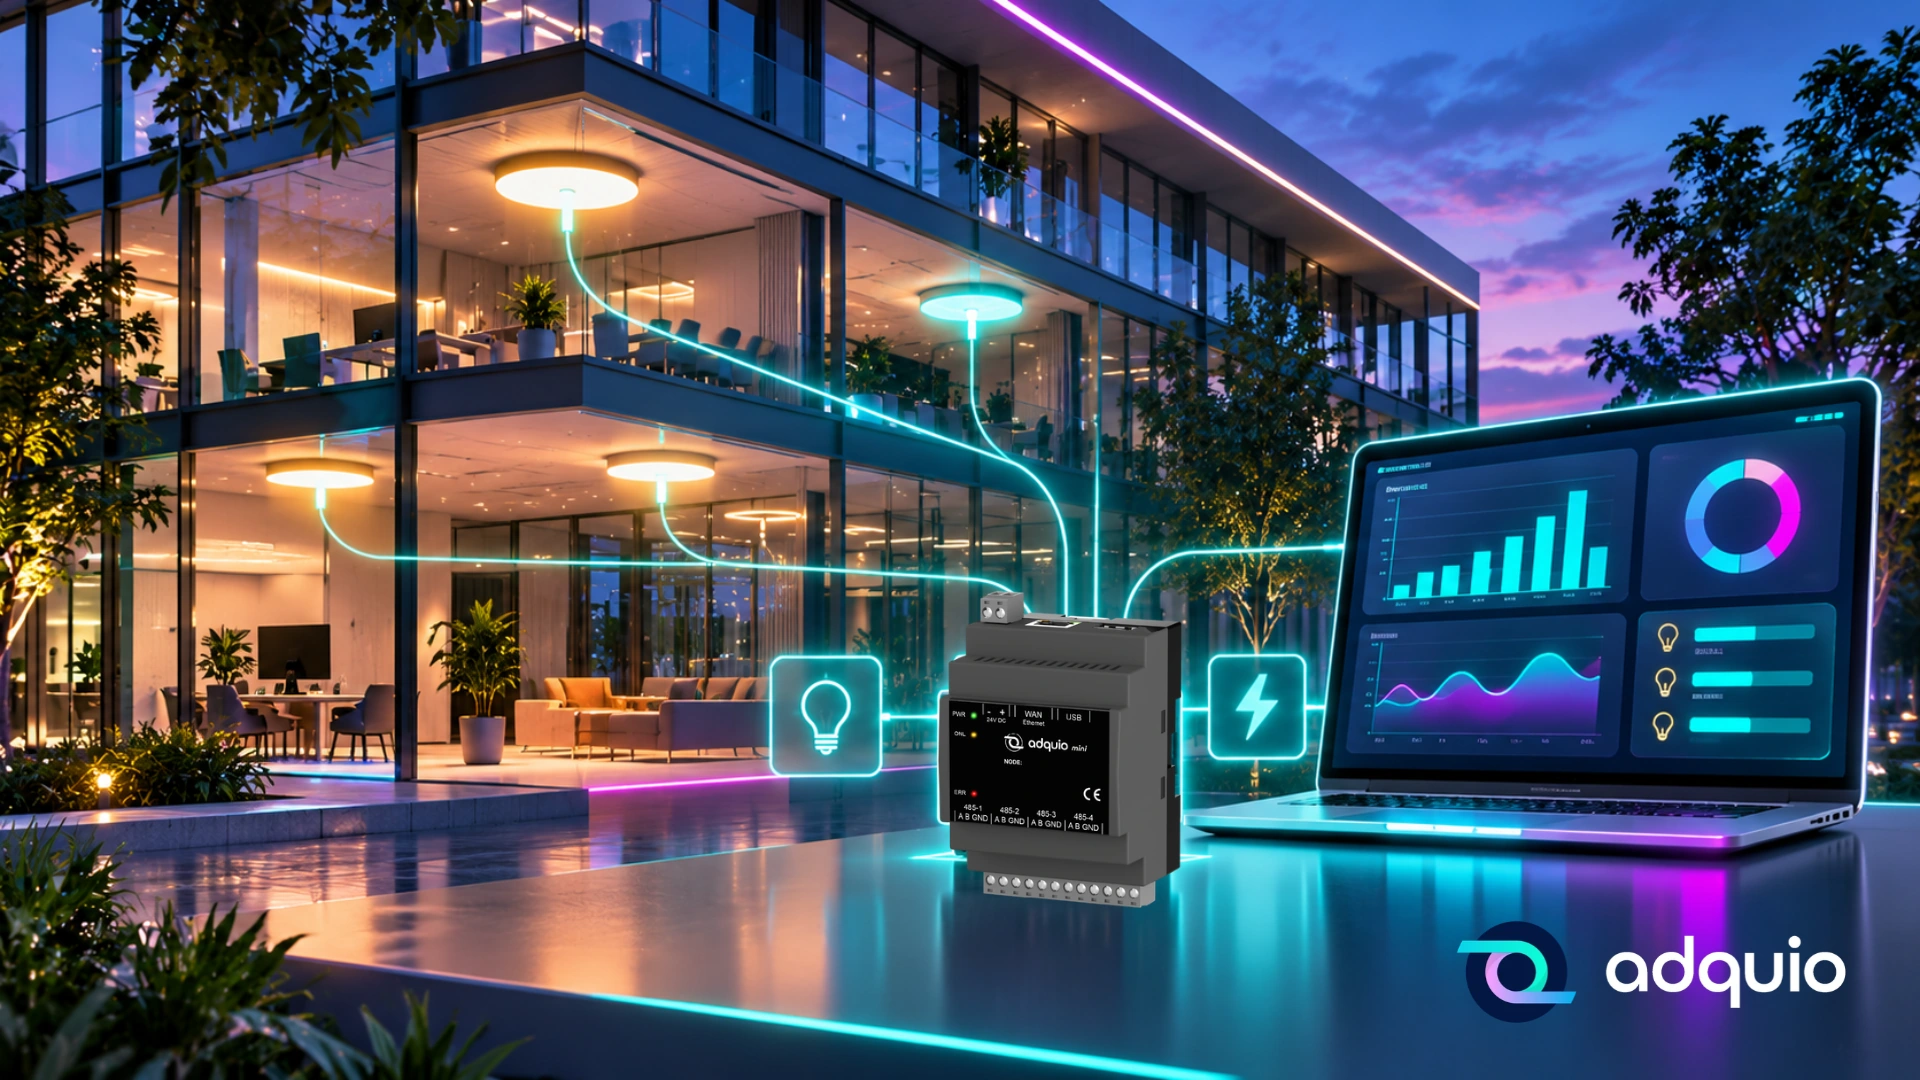
PowerTrace is an Adquio solution that calculates the estimated energy consumption of luminaires in a Casambi installation from their operation.
Put simply:
PowerTrace turns what your lights do into energy data.
It uses information such as each luminaire’s on/off state and dimming level, together with the electrical characteristics of its equipment.
Those data allow it to estimate the power a luminaire is drawing and calculate the energy used over a given period.
An individual electricity meter does not need to be installed at every lighting point.
Information can be organised by luminaire, group, zone, floor or building.
An installation previously used only to control lighting can therefore also become a source of energy information.
A simple example: a 100-watt light
Imagine a luminaire that draws 100 watts when operating at full output.
If it stays on for ten hours, its consumption is:
100 watts × 10 hours = 1,000 watt-hours = 1 kWh.
So far, the calculation is straightforward.
But what happens if the luminaire is not always at full output?
Imagine it operates at 80% in the morning, is then dimmed to 40% as daylight increases, and finally switches off.
Its consumption will be different.
To calculate it properly, we need to know the relationship between dimming level and actual electrical power.
Here is an important point: a luminaire dimmed to 50% light output does not necessarily consume exactly 50% of its maximum power.
That depends on the luminaire’s characteristics and, in particular, its electronic driver.
PowerTrace accounts for these operating profiles to produce an energy estimate that is more representative than simply multiplying rated power by hours of operation.
How can PowerTrace work out what a luminaire consumes?
This is where the technology becomes especially useful.
If you use Casambi, your installation already contains information about lighting operation.
It knows which devices are active, which dimming levels are being used and which changes occur.
PowerTrace uses those events and combines them with technical information about the equipment.
The process can be explained in four steps.
Step 1. Listen to what happens in Casambi
Whenever a luminaire changes state, is dimmed or participates in a scene, information about its operation is generated.
PowerTrace uses the available Casambi network data to track those changes.
It does not need to intervene in normal lighting control.
Its role is to observe and interpret.
Step 2. Understand the electrical characteristics
Not all luminaires consume the same amount of energy.
Two lights that appear to provide similar illumination can use different electronic equipment and draw different amounts of power.
PowerTrace therefore incorporates the electrical profile of each luminaire or driver type.
These data may include rated power, efficiency, standby consumption and the dimming curve.
This links operating levels to estimates of electrical power.
Step 3. Turn events into energy
Once we know how each luminaire is operating and its electrical profile, we can calculate its estimated consumption over time.
For example, if a luminaire operates for two hours at a given level, PowerTrace calculates the corresponding energy use.
When its dimming level changes, the new state is used to continue the calculation.
Adding those intervals gives the luminaire’s estimated consumption.
Adding several luminaires gives the consumption of a zone, a floor or an entire building.
Step 4. Turn the results into useful information
Thousands of values are of little use if nobody can interpret them.
PowerTrace organises data for charts, reports, indicators and energy management tools.
We can review a day’s consumption, compare different periods or analyse which zones use the most energy.
We move from knowing that a light is on to understanding what it costs to keep it running.
The key benefit: energy data without hundreds of additional meters
Imagine a building with 500 luminaires.
Measuring each one individually would require an appropriate physical metering infrastructure.
Depending on how the electrical circuits are organised, that could mean meters, switchboard modifications, wiring or additional communications equipment.
PowerTrace takes a different approach.
If the luminaires are already integrated into Casambi and their electrical characteristics are available, we can estimate individual consumption from operating data.
A physical meter is not needed at every luminaire for that calculation.
This can considerably reduce the complexity of an energy analysis project.
PowerTrace does need appropriate integration components, such as an Adquio controller and the corresponding communications gateways.
But it does not require individual electrical metering infrastructure at every lighting point.
The lighting installation already generates information. PowerTrace turns it into energy insight.
What can we discover with PowerTrace?
Much more than a total consumption figure.
1. Identify which zones use the most energy
Imagine a hotel with guest rooms, corridors, restaurants, meeting rooms and outdoor spaces.
PowerTrace can organise estimated consumption around that structure.
We can then compare the energy used in each area and identify where attention is needed.
We might discover that corridor lighting uses a significant amount of energy at night.
Or that certain outdoor areas remain lit for far longer than necessary.
Without data, these situations can go unnoticed.
With data, we can investigate and decide what to do.
2. Check whether we are actually saving energy
Suppose we change a building’s lighting schedules.
Previously, lights in certain areas switched off at midnight.
Now we switch them off at ten in the evening.
Are we saving energy?
Reducing operating hours can clearly reduce consumption, but by how much?
PowerTrace lets us compare estimated consumption before and after the change.
We can therefore quantify the effect of our decisions.
The same applies when using presence sensors or daylight-based dimming.
Data lets us check whether the savings we expect are being achieved.
3. Detect unnecessary consumption
Some electronic equipment continues to draw a small amount of power even when the lighting is off.
This is known as standby consumption.
Individually, it may seem insignificant.
Across hundreds or thousands of luminaires, however, the total can matter.
PowerTrace can include this consumption in its estimates and help assess its significance.
It also helps identify unusual behaviour, such as areas left on outside their intended schedules.
This can reveal optimisation opportunities that would otherwise be difficult to find.
4. Compare buildings and installations
Imagine a retail chain with thirty stores.
All use Casambi lighting, but their sizes, schedules and configurations differ.
PowerTrace can provide energy information for each installation so they can be compared.
We can identify which stores consume more, which make better use of dimming and where improvements are possible.
For a fair comparison, factors such as floor area, opening hours and each store’s lighting requirements should also be considered.
The result is a more complete view of how energy is being used.
5. Turn consumption into costs
Kilowatt-hours matter, but many people find their financial impact easier to understand.
If we know the estimated energy consumption and the applicable electricity tariffs, we can calculate an approximate lighting cost.
For example, we can estimate the cost of lighting a floor for a month.
Or the potential savings from changing particular schedules.
Reports can also be prepared by zone, department or property.
This is especially useful for building managers and financial teams making decisions based on data.
A practical example: a shopping centre with thousands of luminaires
Imagine a shopping centre with 2,000 Casambi luminaires across corridors, retail areas, entrances and shared spaces.
The lighting works correctly, but management wants to reduce energy consumption.
The difficulty is that only the building’s overall electricity consumption is available.
Management does not know how much each lighting zone accounts for.
With PowerTrace, we can model luminaire consumption and organise the information according to the shopping centre’s layout.
After collecting initial data, the maintenance team identifies areas that remain brightly lit after visitors have left.
They also discover scenes that could be adjusted to make better use of daylight.
Schedules and dimming levels are changed while maintaining visibility and safety requirements.
Managers then compare estimated consumption for equivalent periods.
They can now assess the impact of the changes.
The physical lighting installation is unchanged. What changes is the information available to manage it.
How does PowerTrace differ from an electricity meter?
This distinction matters.
An electricity meter measures electrical quantities through sensors and measuring circuits.
PowerTrace uses a mathematical model to estimate consumption from known luminaire operation and technical characteristics.
The results therefore depend on the quality of the available information.
When driver electrical profiles, dimming curves and standby consumption are correctly understood, the estimates can be very useful for management and optimisation.
Optional calibration using a one-off physical measurement can also be used to adjust the model.
However, an energy estimate is not automatically equivalent to certified metering.
Applications requiring legal metrology, regulated billing or a specific accuracy class must use the appropriate instruments.
PowerTrace is designed particularly for management, energy analysis, identifying improvements and reporting based on consumption models.
How is Adquio PowerTrace installed?
Commissioning is designed to build on existing Casambi installations.
In general, the process is:
First, connect the Casambi installation.
A Lithernet gateway connects the Casambi network to a compatible Adquio controller.
Next, add the luminaire information.
We configure the electrical profiles of the different drivers and associate devices with their corresponding zones or groups.
Then, activate PowerTrace.
The software begins processing operating events and calculating energy estimates.
Finally, organise and visualise the data.
We can review results, create reports and use the data in other platforms.
Calibration with a physical measurement is optional and can improve how closely the model corresponds to actual installation behaviour.
The key is that lighting does not need to be replaced or its normal operation interrupted to add this analytical capability.
PowerTrace and Adquio Analytics: from data to decisions
PowerTrace provides energy information.
The next step is to make that information easy to interpret.
This is where Adquio Analytics comes in.
Analytics creates dashboards and charts for studying how data evolves over time.
Imagine a screen showing today’s estimated lighting consumption, comparing it with yesterday’s or analysing trends over recent months.
You can show charts by floor, compare zones and build indicators suited to your needs.
For example, an energy manager could have a dashboard showing:
- Total estimated lighting consumption.
- Consumption distribution by zone.
- Daily, weekly and monthly trends.
- Comparisons with previous periods.
- Estimated energy costs.
- Indicators for evaluating implemented improvements.
PowerTrace results can also be exported and incorporated into other systems through the available interfaces.
They can therefore be used in management tools, corporate reports or BMS platforms.
PowerTrace calculates. Analytics helps people understand. Together, they support better decisions.
What if my building already has a BMS?
That is not a problem.
PowerTrace is not intended to replace the existing BMS.
Its role is to provide energy information from the lighting installation.
That information can be integrated with other systems through appropriate communications and export mechanisms.
For example, a BMS can receive estimated consumption for different zones and display it alongside HVAC or other installation data.
Lighting can then become part of the building’s overall energy analysis.
This is especially useful where existing energy management platforms need more detailed lighting data.
Who can benefit from PowerTrace?
Almost any organisation with a Casambi installation that wants to understand its consumption better.
Hotels: analyse energy used in guest rooms, corridors and shared areas.
Offices: compare floors, evaluate schedules and improve lighting strategies.
Shopping centres: study consumption across large installations and identify savings opportunities.
Museums: understand the energy impact of different scenes and exhibition schedules.
Retail chains: compare stores and establish energy targets.
Installers and integrators: offer energy analysis services without adding an extensive physical metering infrastructure.
The shared benefit is access to information that was not previously easy to obtain.
A new opportunity for Casambi installers
PowerTrace also creates useful commercial opportunities for lighting professionals.
Traditionally, an installer designs, configures and commissions an installation.
After the project is complete, the client uses the lighting and requests assistance when an adjustment is needed.
What if the installer could also offer an ongoing energy review service?
They could help analyse consumption, review schedules, propose improvements and check the results.
The professional relationship could continue throughout the installation’s life.
Lighting can become a source of added-value services beyond the initial installation project.
For the client, this means having a professional who helps them use lighting more efficiently as well as control it.
Lighting has been generating information for years. Now we can use it.
For a long time, luminaires were seen as devices to switch on, switch off and dim.
Smart control then made scenes, schedules and automation possible.
One important step remained: turning all that activity into energy information.
Every switch-on, dimming change and operating hour tells us something about how a building is used.
PowerTrace uses that information to help us understand lighting consumption.
Without installing a meter at every luminaire.
Without replacing existing Casambi equipment.
And with the option to incorporate results into analytics and management systems.
Lighting can provide information to improve our buildings as well as illuminate them.
That is the real value of Adquio PowerTrace for Casambi.
Want to discover how much energy your lighting installation uses?
If you already use Casambi, much of the information needed to start may already be available.
With Adquio PowerTrace for Casambi, we can help turn that information into useful energy estimates, charts and indicators.
Your lights already know when they operate. Now you can know how much they consume.
Understand your lighting consumption
Tell us how your Casambi installation is organised and what you need to analyse.